
Seller's Agent in 2025
David Rehm
Windermere RE Whatcom, Inc.
(360) 961-5513
44 Total Sales

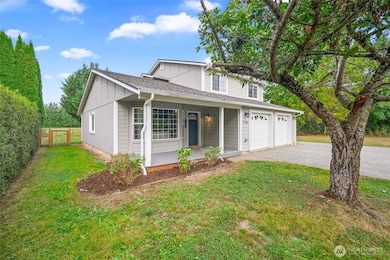
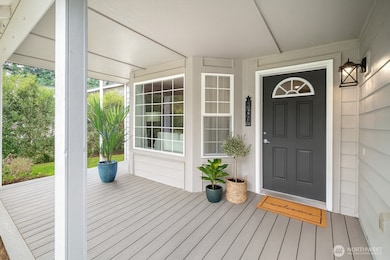
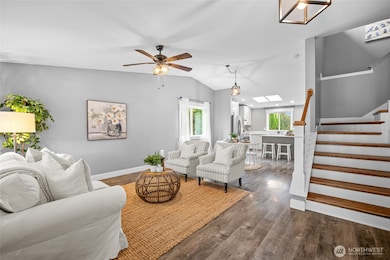
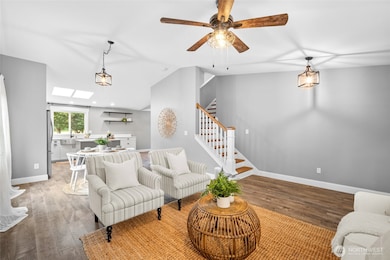
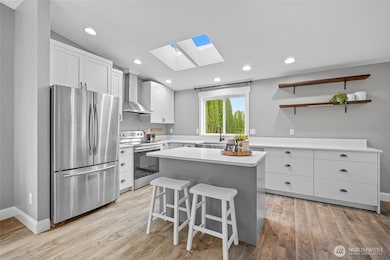
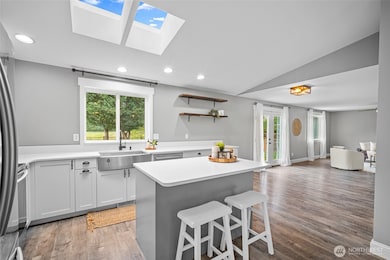
Beautifully updated 3-bed, 2.5-bath home on a generous 10,890 SF lot. Built in 2006 and freshly remodeled, this 1,932 SF residence feels like new with custom cabinetry, quartz countertops, stylish finishes, and a newer roof with years of life ahead. The master bedroom boasts a spacious walk-in closet with built-in organizational shelving. Enjoy incredible privacy in the fenced backyard, enhanced by cedar trees and greenbelt views—perfect for entertaining or relaxing. A roomy 2-car garage and outbuilding provide excellent storage for gear and toys. Truly turn-key and move-in ready.
Last Agent to Sell the Property
Windermere RE Whatcom, Inc. License #23006744 Listed on: 09/26/2025
Source: Northwest Multiple Listing Service (NWMLS)
MLS#: 2437209
| Date | Type | Sale Price | Title Company |
|---|---|---|---|
| Warranty Deed | $510,000 | Chicago Title | |
| Warranty Deed | $510,000 | Chicago Title | |
| Warranty Deed | $40,280 | Stewart Title Company | |
| Warranty Deed | $28,000 | Whatcom Land Title |
| Date | Status | Loan Amount | Loan Type |
|---|---|---|---|
| Open | $484,500 | New Conventional | |
| Closed | $484,500 | New Conventional | |
| Previous Owner | $188,000 | Construction |
| Date | Event | Price | List to Sale | Price per Sq Ft |
|---|---|---|---|---|
| 11/26/2025 11/26/25 | Sold | $510,000 | 0.0% | $264 / Sq Ft |
| 10/11/2025 10/11/25 | Pending | -- | -- | -- |
| 10/07/2025 10/07/25 | Price Changed | $510,000 | -2.9% | $264 / Sq Ft |
| 09/26/2025 09/26/25 | For Sale | $525,000 | -- | $272 / Sq Ft |
| Year | Tax Paid | Tax Assessment Tax Assessment Total Assessment is a certain percentage of the fair market value that is determined by local assessors to be the total taxable value of land and additions on the property. | Land | Improvement |
|---|---|---|---|---|
| 2025 | $3,917 | $434,496 | $188,100 | $246,396 |
| 2024 | $3,827 | $420,386 | $180,000 | $240,386 |
| 2023 | $3,827 | $425,984 | $130,857 | $295,127 |
| 2022 | $3,509 | $383,776 | $117,891 | $265,885 |
| 2021 | $3,259 | $317,174 | $97,432 | $219,742 |
| 2020 | $3,128 | $257,871 | $79,215 | $178,656 |
| 2019 | $2,646 | $257,871 | $79,215 | $178,656 |
| 2018 | $3,225 | $247,406 | $76,000 | $171,406 |
| 2017 | $2,889 | $225,392 | $57,304 | $168,088 |
| 2016 | $2,762 | $207,994 | $52,858 | $155,136 |
| 2015 | $2,354 | $199,497 | $50,981 | $148,516 |
| 2014 | -- | $193,311 | $49,400 | $143,911 |
| 2013 | -- | $193,311 | $49,400 | $143,911 |
Seller's Agent in 2025
David Rehm
Windermere RE Whatcom, Inc.
(360) 961-5513
44 Total Sales
Buyer's Agent in 2025
Luis Herrera
RE/MAX Whatcom County
(360) 389-6714
142 Total Sales
Source: Northwest Multiple Listing Service (NWMLS)
MLS Number: 2437209
APN: 400429-363386-0000
Disclaimer: Certain information contained herein is derived from information provided by parties other than Homes.com. All information provided is deemed reliable, but is not guaranteed to be accurate and should be independently verified.
![]() All data is obtained from various sources and may not have been verified by broker or MLS GRID. Supplied Open House Information is subject to change without notice. All information should be independently reviewed and verified for accuracy. Properties may or may not be listed by the office/agent presenting the information. Listing information is provided by the Northwest Multiple Listing Service (NWMLS). Property information is based on available data that may include MLS information, county records, and other sources. Listings marked with the 3 tree icon and provided by NWMLS. All properties are subject to prior sale or withdrawal. IDX information is provided exclusively for consumers’ personal noncommercial use, that it may not be used for any purpose other than to identify prospective properties consumers may be interested in purchasing, that the data is deemed reliable but is not guaranteed by MLS GRID. ©2026 NWMLS.
All data is obtained from various sources and may not have been verified by broker or MLS GRID. Supplied Open House Information is subject to change without notice. All information should be independently reviewed and verified for accuracy. Properties may or may not be listed by the office/agent presenting the information. Listing information is provided by the Northwest Multiple Listing Service (NWMLS). Property information is based on available data that may include MLS information, county records, and other sources. Listings marked with the 3 tree icon and provided by NWMLS. All properties are subject to prior sale or withdrawal. IDX information is provided exclusively for consumers’ personal noncommercial use, that it may not be used for any purpose other than to identify prospective properties consumers may be interested in purchasing, that the data is deemed reliable but is not guaranteed by MLS GRID. ©2026 NWMLS.
Based on information submitted to the MLS GRID
Ask me questions while you tour the home.