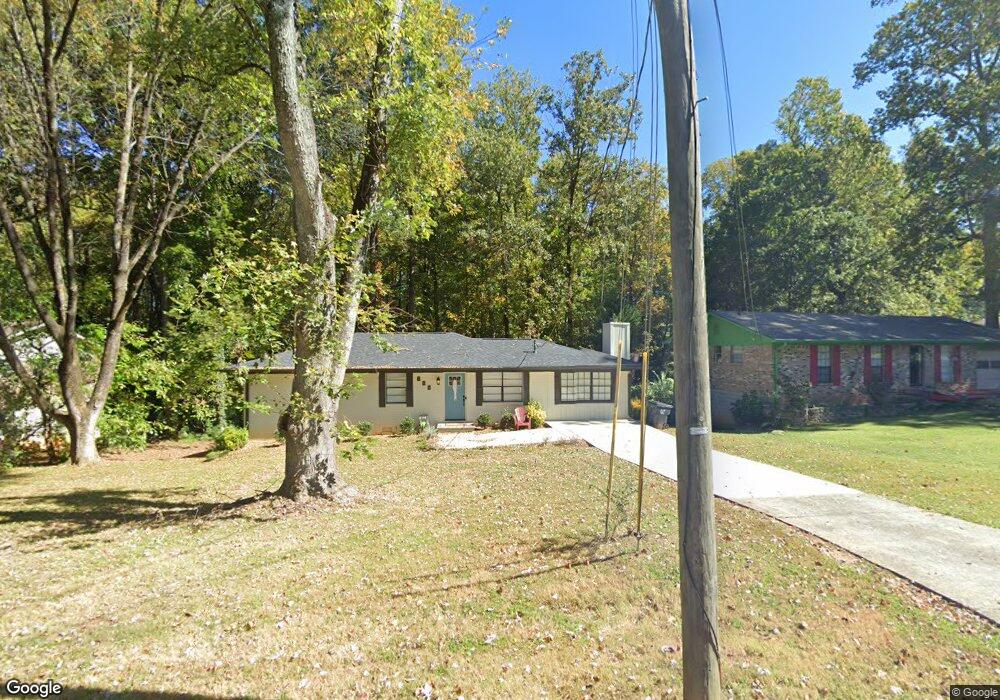
709 E Glochester Place Unit 14 Norcross, GA 30071
Estimated Value: $318,000 - $370,000
3
Beds
1
Bath
1,302
Sq Ft
$262/Sq Ft
Est. Value
About This Home
This home is located at 709 E Glochester Place Unit 14, Norcross, GA 30071 and is currently estimated at $340,590, approximately $261 per square foot. 709 E Glochester Place Unit 14 is a home located in Gwinnett County with nearby schools including Baldwin Elementary, Summerour Middle School, and Paul Duke STEM High School.
Ownership History
Date
Name
Owned For
Owner Type
Purchase Details
Closed on
Apr 18, 2023
Sold by
Mcwilliams Deshia Cheri
Bought by
Meyer Geoffrey Allen and Woodall Hillary Bray
Current Estimated Value
Home Financials for this Owner
Home Financials are based on the most recent Mortgage that was taken out on this home.
Original Mortgage
$299,700
Outstanding Balance
$290,448
Interest Rate
6.42%
Mortgage Type
New Conventional
Estimated Equity
$50,142
Purchase Details
Closed on
Feb 19, 2021
Sold by
Fieldstone View Llc
Bought by
Mcwilliams Deshia Cheri
Home Financials for this Owner
Home Financials are based on the most recent Mortgage that was taken out on this home.
Original Mortgage
$244,246
Interest Rate
2.7%
Mortgage Type
New Conventional
Purchase Details
Closed on
Apr 19, 2019
Sold by
Falcon Mutual Llc
Bought by
Fieldstone View Llc
Create a Home Valuation Report for This Property
The Home Valuation Report is an in-depth analysis detailing your home's value as well as a comparison with similar homes in the area
Home Values in the Area
Average Home Value in this Area
Purchase History
| Date | Buyer | Sale Price | Title Company |
|---|---|---|---|
| Meyer Geoffrey Allen | $333,000 | -- | |
| Mcwilliams Deshia Cheri | $251,800 | -- | |
| Fieldstone View Llc | $129,876 | -- | |
| Falcon Mutual Llc | $96,000 | -- |
Source: Public Records
Mortgage History
| Date | Status | Borrower | Loan Amount |
|---|---|---|---|
| Open | Meyer Geoffrey Allen | $299,700 | |
| Previous Owner | Mcwilliams Deshia Cheri | $244,246 |
Source: Public Records
Tax History Compared to Growth
Tax History
| Year | Tax Paid | Tax Assessment Tax Assessment Total Assessment is a certain percentage of the fair market value that is determined by local assessors to be the total taxable value of land and additions on the property. | Land | Improvement |
|---|---|---|---|---|
| 2025 | $3,869 | $133,440 | $25,840 | $107,600 |
| 2024 | $3,991 | $133,200 | $25,600 | $107,600 |
| 2023 | $3,991 | $125,880 | $20,800 | $105,080 |
| 2022 | $3,233 | $100,720 | $20,800 | $79,920 |
| 2021 | $1,703 | $51,920 | $14,320 | $37,600 |
| 2020 | $1,716 | $51,920 | $14,320 | $37,600 |
| 2019 | $2,440 | $55,680 | $12,000 | $43,680 |
| 2018 | $1,844 | $55,680 | $12,000 | $43,680 |
| 2016 | $1,361 | $41,160 | $9,200 | $31,960 |
| 2015 | $1,354 | $29,360 | $8,000 | $21,360 |
| 2014 | $744 | $22,040 | $8,000 | $14,040 |
Source: Public Records
Map
Nearby Homes
- 2848 Wild Laurel Ct
- 5766 Buford Hwy
- 5645 Hammond Dr
- 5596 Buford Hwy
- 2199 Summertown Dr
- 2798 Maddison Towns Ave
- 6023 Skellig St
- 90 W Peachtree St
- 5639 Chatham Cir
- 5479 Windy Creek Ln
- 622 Summer Place
- 5457 Rails Way
- 186 Wingo St
- 204 Wingo St
- 2375 Beaver Falls Dr
- 435 Webb Dr
- 63 Born St NW
- 6000 Hunter Hall Ct
- 5364 Hickory Knoll
- 5358 Beaver Branch
- 709 E Glochester Place
- 727 E Glochester Place Unit 1
- 693 E Glochester Place
- 743 E Glochester Place
- 679 E Glochester Place
- 716 E Glochester Place
- 615 Winchester Ln
- 761 E Glochester Place Unit 1
- 738 E Glochester Place Unit 1
- 663 E Glochester Place
- 636 Winchester Ln Unit 1
- 664 E Glochester Place
- 635 Winchester Ln
- 657 Camelot Way
- 549 E Glochester Place
- 630 Camelot Way Unit 1
- 797 E Glochester Place
- 586 Glochester Place
- 650 Winchester Ln
- 675 Camelot Way Unit 1