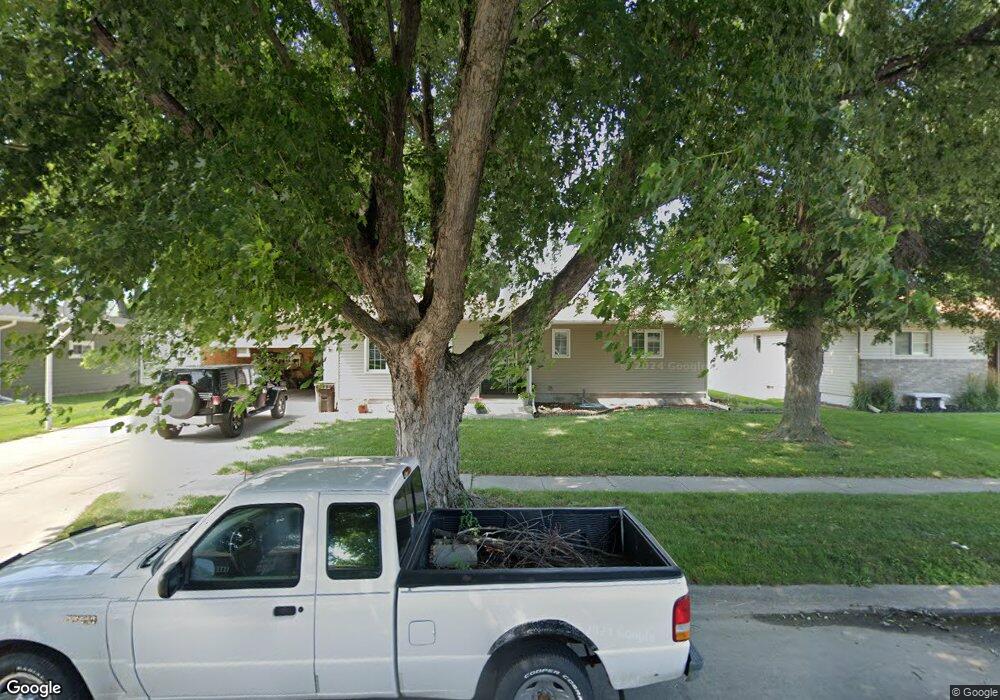
709 E Prospect Ave Norfolk, NE 68701
Estimated Value: $275,408 - $328,000
3
Beds
3
Baths
1,344
Sq Ft
$225/Sq Ft
Est. Value
About This Home
This home is located at 709 E Prospect Ave, Norfolk, NE 68701 and is currently estimated at $301,852, approximately $224 per square foot. 709 E Prospect Ave is a home located in Madison County with nearby schools including Norfolk Senior High School, Keystone Christian Academy, and Park Avenue Christian School.
Ownership History
Date
Name
Owned For
Owner Type
Purchase Details
Closed on
Apr 2, 2025
Sold by
Swanson Eric C and Swanson Anne E
Bought by
Swanson Eric C and Swanson Anne E
Current Estimated Value
Purchase Details
Closed on
Sep 29, 2008
Sold by
Kyriss Gordon and Kyriss Cheryl L
Bought by
Swanson Eric C
Home Financials for this Owner
Home Financials are based on the most recent Mortgage that was taken out on this home.
Original Mortgage
$146,050
Interest Rate
6.57%
Mortgage Type
VA
Purchase Details
Closed on
Sep 3, 2008
Sold by
Kyriss Gordon and Kyriss Cherryl L
Bought by
Swanson Eric C
Home Financials for this Owner
Home Financials are based on the most recent Mortgage that was taken out on this home.
Original Mortgage
$146,050
Interest Rate
6.57%
Mortgage Type
VA
Purchase Details
Closed on
Aug 3, 2004
Sold by
Kyriss Gordon
Bought by
Kyriss Gordon and Kyriss Cheryl L
Purchase Details
Closed on
Jun 5, 2003
Sold by
Greenough William K and Greenough Judy A
Bought by
Kyriss Gordon
Create a Home Valuation Report for This Property
The Home Valuation Report is an in-depth analysis detailing your home's value as well as a comparison with similar homes in the area
Home Values in the Area
Average Home Value in this Area
Purchase History
| Date | Buyer | Sale Price | Title Company |
|---|---|---|---|
| Swanson Eric C | -- | None Listed On Document | |
| Swanson Eric C | -- | None Listed On Document | |
| Swanson Eric C | $143,000 | -- | |
| Swanson Eric C | $143,000 | American Title | |
| Kyriss Gordon | -- | -- | |
| Kyriss Gordon | $129,500 | -- |
Source: Public Records
Mortgage History
| Date | Status | Borrower | Loan Amount |
|---|---|---|---|
| Previous Owner | Swanson Eric C | $146,050 |
Source: Public Records
Tax History
| Year | Tax Paid | Tax Assessment Tax Assessment Total Assessment is a certain percentage of the fair market value that is determined by local assessors to be the total taxable value of land and additions on the property. | Land | Improvement |
|---|---|---|---|---|
| 2025 | $2,738 | $237,115 | $13,055 | $224,060 |
| 2024 | $2,738 | $220,518 | $13,055 | $207,463 |
| 2023 | $3,760 | $203,388 | $13,055 | $190,333 |
| 2022 | $3,392 | $182,995 | $13,055 | $169,940 |
| 2021 | $3,126 | $168,963 | $13,055 | $155,908 |
| 2020 | $3,116 | $168,963 | $13,055 | $155,908 |
| 2019 | $2,981 | $156,090 | $13,055 | $143,035 |
| 2018 | $2,738 | $145,765 | $13,055 | $132,710 |
| 2017 | $2,742 | $145,765 | $13,055 | $132,710 |
| 2016 | $2,636 | $139,870 | $13,055 | $126,815 |
| 2015 | $2,637 | $139,870 | $13,055 | $126,815 |
| 2014 | $2,715 | $139,870 | $13,055 | $126,815 |
| 2013 | $2,612 | $130,337 | $10,081 | $120,256 |
Source: Public Records
Map
Nearby Homes
- 801 E Prospect Ave
- 707 E Prospect Ave
- 708 E Klug Ave
- 706 E Klug Ave
- 800 E Klug Ave
- 803 E Prospect Ave
- 705 E Prospect Ave
- 708 E Prospect Ave
- 704 E Klug Ave
- 800 E Prospect Ave
- 806 E Klug Ave
- 706 E Prospect Ave
- 703 E Prospect Ave
- 802 E Prospect Ave
- 805 E Prospect Ave
- 702 E Klug Ave
- 704 E Prospect Ave
- 804 E Prospect Ave
- 701 E Prospect Ave
- 402 N Boxelder St
Your Personal Tour Guide
Ask me questions while you tour the home.