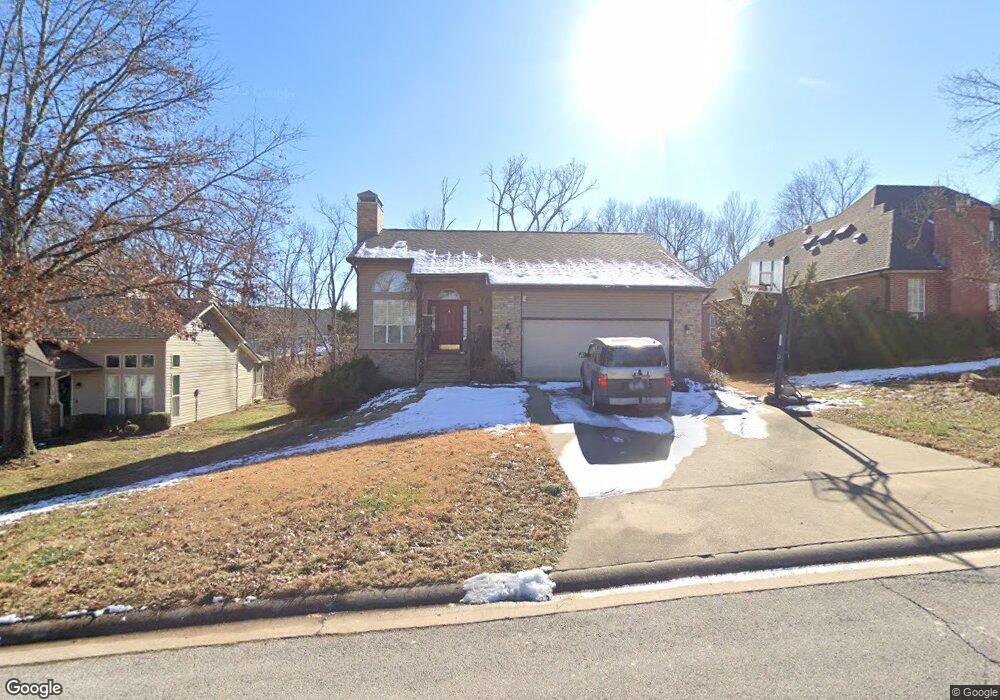
709 Foxfire Ln Bentonville, AR 72712
Estimated Value: $457,000 - $613,000
3
Beds
3
Baths
2,390
Sq Ft
$233/Sq Ft
Est. Value
About This Home
This home is located at 709 Foxfire Ln, Bentonville, AR 72712 and is currently estimated at $556,729, approximately $232 per square foot. 709 Foxfire Ln is a home located in Benton County with nearby schools including Thomas Jefferson Elementary School, Lincoln Junior High School, and Old High Middle School.
Ownership History
Date
Name
Owned For
Owner Type
Purchase Details
Closed on
May 24, 2010
Sold by
Vanderbush Neil S and Vanderbush Holly R
Bought by
Cheong Chee Ming
Current Estimated Value
Home Financials for this Owner
Home Financials are based on the most recent Mortgage that was taken out on this home.
Original Mortgage
$194,750
Outstanding Balance
$129,710
Interest Rate
5%
Mortgage Type
New Conventional
Estimated Equity
$427,019
Purchase Details
Closed on
Jun 1, 2007
Sold by
Bryce James Dean and Bryce Jeanine H
Bought by
Vanderbush Neil S and Vanderbush Holly R
Home Financials for this Owner
Home Financials are based on the most recent Mortgage that was taken out on this home.
Original Mortgage
$196,000
Interest Rate
6.15%
Mortgage Type
VA
Purchase Details
Closed on
Aug 2, 1996
Bought by
Bryce
Purchase Details
Closed on
Aug 16, 1993
Bought by
Hunter
Purchase Details
Closed on
Mar 16, 1992
Bought by
Ploen
Purchase Details
Closed on
Sep 11, 1990
Bought by
Lbg
Create a Home Valuation Report for This Property
The Home Valuation Report is an in-depth analysis detailing your home's value as well as a comparison with similar homes in the area
Home Values in the Area
Average Home Value in this Area
Purchase History
| Date | Buyer | Sale Price | Title Company |
|---|---|---|---|
| Cheong Chee Ming | $205,000 | None Available | |
| Vanderbush Neil S | $196,000 | None Available | |
| Bryce | $141,000 | -- | |
| Hunter | $127,000 | -- | |
| Ploen | $97,000 | -- | |
| Lbg | $35,000 | -- |
Source: Public Records
Mortgage History
| Date | Status | Borrower | Loan Amount |
|---|---|---|---|
| Open | Cheong Chee Ming | $194,750 | |
| Previous Owner | Vanderbush Neil S | $196,000 |
Source: Public Records
Tax History Compared to Growth
Tax History
| Year | Tax Paid | Tax Assessment Tax Assessment Total Assessment is a certain percentage of the fair market value that is determined by local assessors to be the total taxable value of land and additions on the property. | Land | Improvement |
|---|---|---|---|---|
| 2025 | $2,874 | $87,846 | $15,000 | $72,846 |
| 2024 | $2,756 | $87,846 | $15,000 | $72,846 |
| 2023 | $2,625 | $54,470 | $8,600 | $45,870 |
| 2022 | $2,197 | $54,470 | $8,600 | $45,870 |
| 2021 | $2,072 | $54,470 | $8,600 | $45,870 |
| 2020 | $1,977 | $36,930 | $3,800 | $33,130 |
| 2019 | $1,977 | $36,930 | $3,800 | $33,130 |
| 2018 | $2,002 | $36,930 | $3,800 | $33,130 |
| 2017 | $1,929 | $36,930 | $3,800 | $33,130 |
| 2016 | $1,929 | $36,930 | $3,800 | $33,130 |
| 2015 | $2,327 | $37,650 | $4,400 | $33,250 |
| 2014 | $1,977 | $37,650 | $4,400 | $33,250 |
Source: Public Records
Map
Nearby Homes
- 2311 NW Harvard Walk
- 9 Hanna Dr
- 3419 NW Riverbend Rd
- 0 NW Turner Dr
- Lot 3 NW Hidden Cove
- 14 Valley View Cir
- 3702 NW Mountainview Rd
- 3703 NW Mountainview Rd
- 2017 NW Desoto Dr
- 802 NW 20th St
- 3802 NW Riverbend Rd
- 5 NW Robson Way
- 1703 Kimberly Place
- 1605 Kimberly Place
- 219 Ridgefield
- 1606 Kimberly Place
- 203 NW Lasalle Dr
- 12502 Slaughter Pen Rd
- 30 Theodore Dr
- 28 Theodore Dr
- 711 Foxfire Ln
- 707 Foxfire Ln
- 801 Foxfire Lane-Duplicate
- 801 Foxfire Ln
- 705 Foxfire Ln
- 710 Foxfire Ln
- 708 Foxfire Ln
- 800 Foxfire Ln
- 803 Foxfire Ln
- 706 Foxfire Ln
- 802 Foxfire Ln
- 805 Foxfire Ln
- 704 Foxfire Ln
- 3005 Cardinal Creek Cir
- 3100 Cardinal Creek Cir
- 804 Foxfire Ln
- 2911 N Walton Blvd
- Na Cardinal Creek Cir
- 0 Cardinal Creek Cir Unit 346534
- 0 Cardinal Creek Cir Unit 274964