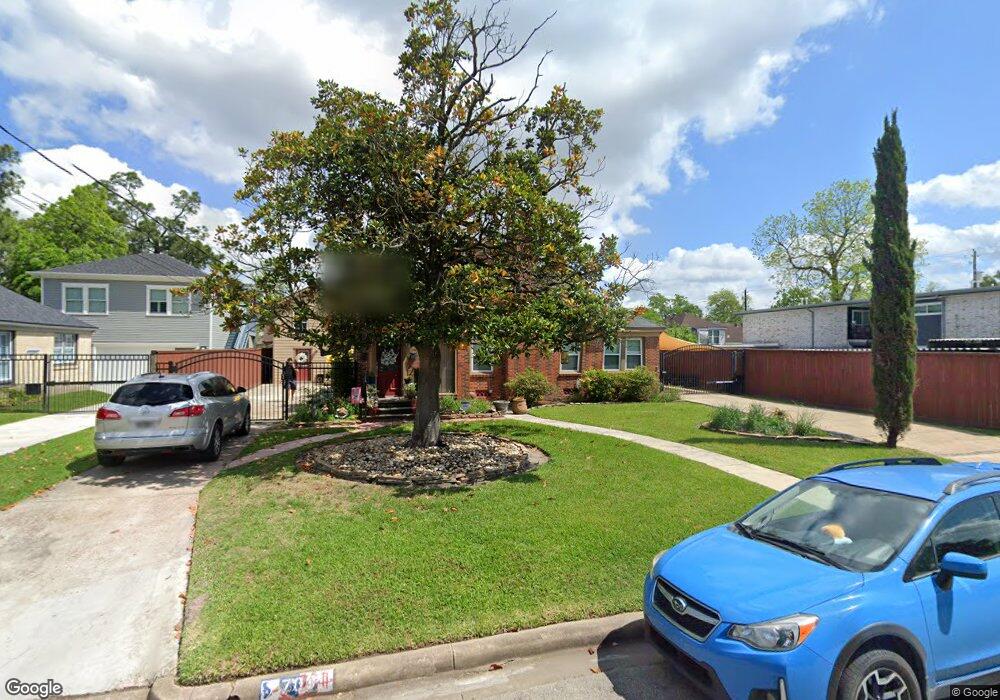
709 Gale St Unit 1/2 Houston, TX 77009
Northside Village NeighborhoodEstimated Value: $481,000 - $778,000
1
Bed
1
Bath
849
Sq Ft
$704/Sq Ft
Est. Value
About This Home
This home is located at 709 Gale St Unit 1/2, Houston, TX 77009 and is currently estimated at $598,070, approximately $704 per square foot. 709 Gale St Unit 1/2 is a home located in Harris County with nearby schools including Jefferson Elementary School, Marshall Middle, and Northside High School.
Ownership History
Date
Name
Owned For
Owner Type
Purchase Details
Closed on
Mar 9, 2020
Sold by
Patterson William D and Patterson Cheryl E
Bought by
Kuhlmann Joyce
Current Estimated Value
Purchase Details
Closed on
Jul 15, 2016
Sold by
Reyna Linda and Sanford Mark
Bought by
James Daniel and James Ana James
Purchase Details
Closed on
Jun 26, 2014
Sold by
Bartel Robert Sean and Bartel Lenca Yew
Bought by
Brown William L and Drufuka Silvia E
Create a Home Valuation Report for This Property
The Home Valuation Report is an in-depth analysis detailing your home's value as well as a comparison with similar homes in the area
Home Values in the Area
Average Home Value in this Area
Purchase History
| Date | Buyer | Sale Price | Title Company |
|---|---|---|---|
| Kuhlmann Joyce | -- | Texas American Title Company | |
| James Daniel | -- | None Available | |
| Brown William L | -- | Alamo Title Co |
Source: Public Records
Tax History Compared to Growth
Tax History
| Year | Tax Paid | Tax Assessment Tax Assessment Total Assessment is a certain percentage of the fair market value that is determined by local assessors to be the total taxable value of land and additions on the property. | Land | Improvement |
|---|---|---|---|---|
| 2025 | $5,281 | $393,457 | $216,913 | $176,544 |
| 2024 | $5,281 | $393,457 | $216,913 | $176,544 |
| 2023 | $5,281 | $416,208 | $216,913 | $199,295 |
| 2022 | $6,673 | $370,443 | $194,250 | $176,193 |
| 2021 | $6,421 | $310,874 | $148,925 | $161,949 |
| 2020 | $6,065 | $284,856 | $148,925 | $135,931 |
| 2019 | $5,762 | $274,661 | $148,925 | $125,736 |
| 2018 | $3,909 | $207,000 | $148,925 | $58,075 |
| 2017 | $5,508 | $227,065 | $148,925 | $78,140 |
| 2016 | $5,007 | $221,147 | $166,950 | $54,197 |
| 2015 | $3,204 | $199,985 | $111,300 | $88,685 |
| 2014 | $3,204 | $163,663 | $103,350 | $60,313 |
Source: Public Records
Map
Nearby Homes