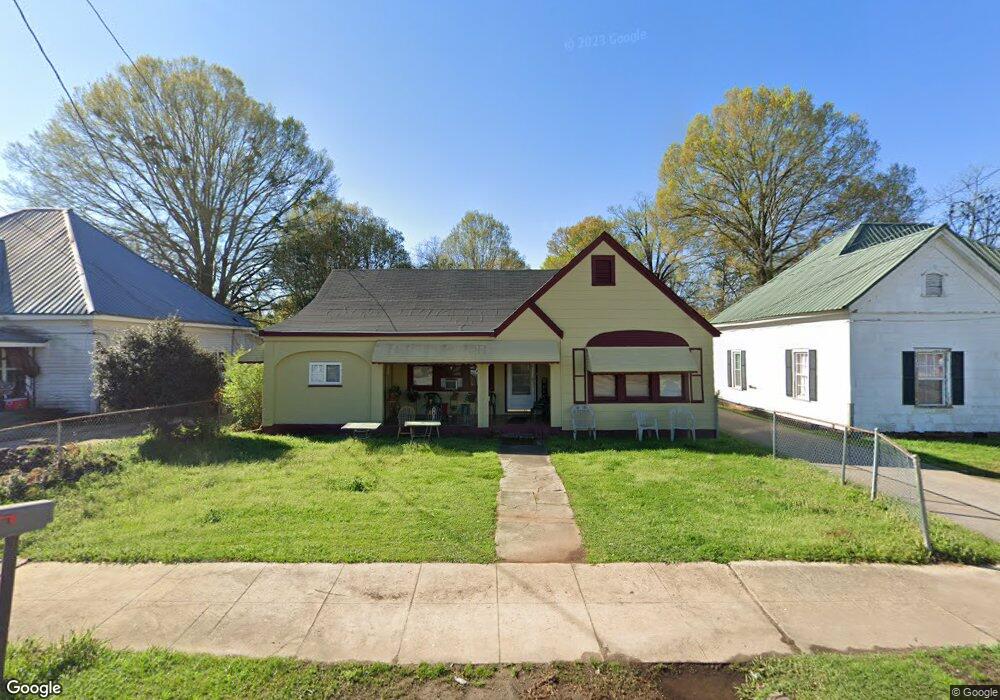
709 Hill St Lagrange, GA 30241
Estimated Value: $107,570 - $261,000
2
Beds
2
Baths
1,315
Sq Ft
$140/Sq Ft
Est. Value
About This Home
This home is located at 709 Hill St, Lagrange, GA 30241 and is currently estimated at $183,643, approximately $139 per square foot. 709 Hill St is a home with nearby schools including Franklin Forest Elementary School, Hollis Hand Elementary School, and Ethel W. Kight Elementary School.
Ownership History
Date
Name
Owned For
Owner Type
Purchase Details
Closed on
Mar 29, 2019
Sold by
Blackwell Realty And Land Holding Co Llc
Bought by
Yingling Property Management Llc
Current Estimated Value
Home Financials for this Owner
Home Financials are based on the most recent Mortgage that was taken out on this home.
Original Mortgage
$104,594
Outstanding Balance
$79,106
Interest Rate
4.3%
Mortgage Type
New Conventional
Estimated Equity
$104,537
Purchase Details
Closed on
Aug 13, 2003
Sold by
Ann David and Ann Blackwell
Bought by
Blackwell Realty & Lnd Hld Co
Purchase Details
Closed on
Aug 4, 1997
Sold by
Irene Gladney Harman
Bought by
Ann David and Ann Blackwell
Purchase Details
Closed on
Jul 15, 1996
Sold by
William Marion Harmon By Ex
Bought by
Irene Gladney Harman
Purchase Details
Closed on
Jun 9, 1975
Sold by
James Gallant
Bought by
William Marion Harmon By Ex
Purchase Details
Closed on
Mar 15, 1975
Bought by
James Gallant
Purchase Details
Closed on
Jan 1, 1965
Sold by
Lucille R Clowe
Create a Home Valuation Report for This Property
The Home Valuation Report is an in-depth analysis detailing your home's value as well as a comparison with similar homes in the area
Purchase History
| Date | Buyer | Sale Price | Title Company |
|---|---|---|---|
| Yingling Property Management Llc | $112,000 | -- | |
| Blackwell Realty & Lnd Hld Co | -- | -- | |
| Ann David | $32,000 | -- | |
| Irene Gladney Harman | -- | -- | |
| William Marion Harmon By Ex | -- | -- | |
| James Gallant | -- | -- | |
| -- | -- | -- |
Source: Public Records
Mortgage History
| Date | Status | Borrower | Loan Amount |
|---|---|---|---|
| Open | Yingling Property Management Llc | $104,594 |
Source: Public Records
Tax History
| Year | Tax Paid | Tax Assessment Tax Assessment Total Assessment is a certain percentage of the fair market value that is determined by local assessors to be the total taxable value of land and additions on the property. | Land | Improvement |
|---|---|---|---|---|
| 2025 | $969 | $35,520 | $2,800 | $32,720 |
| 2024 | $873 | $32,000 | $2,800 | $29,200 |
| 2023 | $620 | $22,720 | $2,800 | $19,920 |
| 2022 | $602 | $21,560 | $2,800 | $18,760 |
| 2021 | $421 | $13,960 | $2,800 | $11,160 |
| 2020 | $409 | $13,960 | $2,800 | $11,160 |
| 2019 | $401 | $13,280 | $2,800 | $10,480 |
| 2018 | $339 | $11,230 | $750 | $10,480 |
| 2017 | $339 | $11,230 | $750 | $10,480 |
| 2016 | $349 | $11,580 | $750 | $10,830 |
| 2015 | $348 | $11,530 | $700 | $10,830 |
| 2014 | $332 | $10,960 | $700 | $10,260 |
| 2013 | -- | $11,818 | $700 | $11,118 |
Source: Public Records
Map
Nearby Homes
Your Personal Tour Guide
Ask me questions while you tour the home.