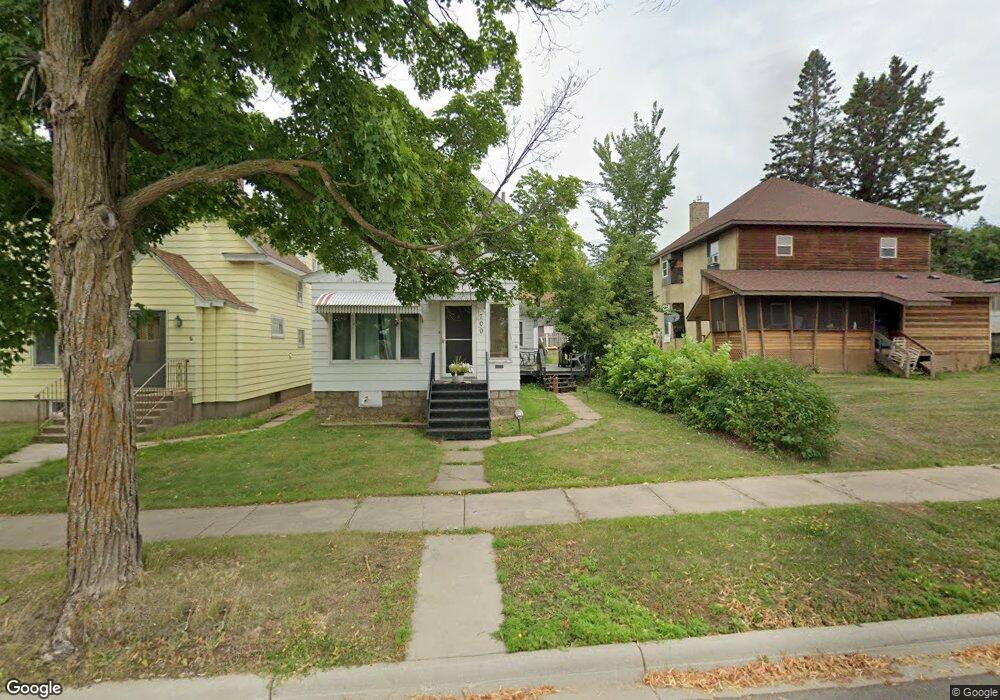
709 Jackson St Eveleth, MN 55734
Estimated Value: $115,000 - $123,000
3
Beds
2
Baths
1,437
Sq Ft
$82/Sq Ft
Est. Value
About This Home
This home is located at 709 Jackson St, Eveleth, MN 55734 and is currently estimated at $117,919, approximately $82 per square foot. 709 Jackson St is a home located in St. Louis County with nearby schools including East Range Academy of Technology & Science.
Ownership History
Date
Name
Owned For
Owner Type
Purchase Details
Closed on
May 26, 2011
Sold by
Richards John and Richards John T
Bought by
Lind Jesse J
Current Estimated Value
Home Financials for this Owner
Home Financials are based on the most recent Mortgage that was taken out on this home.
Original Mortgage
$87,046
Outstanding Balance
$60,270
Interest Rate
4.8%
Mortgage Type
New Conventional
Estimated Equity
$57,649
Purchase Details
Closed on
Aug 20, 2008
Sold by
Richards Dan J
Bought by
Richards John T
Home Financials for this Owner
Home Financials are based on the most recent Mortgage that was taken out on this home.
Original Mortgage
$59,000
Interest Rate
6.66%
Mortgage Type
Purchase Money Mortgage
Create a Home Valuation Report for This Property
The Home Valuation Report is an in-depth analysis detailing your home's value as well as a comparison with similar homes in the area
Home Values in the Area
Average Home Value in this Area
Purchase History
| Date | Buyer | Sale Price | Title Company |
|---|---|---|---|
| Lind Jesse J | $84,000 | Up North Title Inc | |
| Richards John T | $25,000 | All American Title Co Inc |
Source: Public Records
Mortgage History
| Date | Status | Borrower | Loan Amount |
|---|---|---|---|
| Open | Lind Jesse J | $87,046 | |
| Previous Owner | Richards John T | $59,000 |
Source: Public Records
Tax History
| Year | Tax Paid | Tax Assessment Tax Assessment Total Assessment is a certain percentage of the fair market value that is determined by local assessors to be the total taxable value of land and additions on the property. | Land | Improvement |
|---|---|---|---|---|
| 2024 | $2,074 | $97,000 | $4,200 | $92,800 |
| 2023 | $2,074 | $98,100 | $4,100 | $94,000 |
| 2022 | $1,740 | $73,400 | $3,800 | $69,600 |
| 2021 | $1,636 | $78,900 | $3,400 | $75,500 |
| 2020 | $714 | $78,900 | $3,400 | $75,500 |
| 2019 | $606 | $78,900 | $3,400 | $75,500 |
| 2018 | $444 | $78,900 | $3,400 | $75,500 |
| 2017 | $416 | $70,100 | $3,400 | $66,700 |
| 2016 | $372 | $66,000 | $3,400 | $62,600 |
| 2015 | $342 | $39,600 | $2,100 | $37,500 |
| 2014 | $342 | $39,600 | $2,100 | $37,500 |
Source: Public Records
Map
Nearby Homes
Your Personal Tour Guide
Ask me questions while you tour the home.