709 Juniper Trail Waverly Hall, GA 31831
Estimated Value: $287,000 - $516,541
13
Beds
3
Baths
4,216
Sq Ft
$102/Sq Ft
Est. Value
About This Home
This home is located at 709 Juniper Trail, Waverly Hall, GA 31831 and is currently estimated at $429,847, approximately $101 per square foot. 709 Juniper Trail is a home with nearby schools including Central School.
Ownership History
Date
Name
Owned For
Owner Type
Purchase Details
Closed on
Mar 14, 2022
Sold by
Thomas Trenda
Bought by
Thomas Christopher Lewis
Current Estimated Value
Home Financials for this Owner
Home Financials are based on the most recent Mortgage that was taken out on this home.
Original Mortgage
$472,000
Outstanding Balance
$440,651
Interest Rate
3.85%
Mortgage Type
New Conventional
Estimated Equity
-$10,804
Purchase Details
Closed on
Dec 21, 2016
Sold by
Robert
Bought by
Thomas Trenda
Purchase Details
Closed on
Mar 19, 2008
Sold by
Trenda Thomas
Bought by
Thomas Trenda
Purchase Details
Closed on
Dec 23, 2004
Sold by
Kg Investment
Bought by
Hobbs Trenda
Create a Home Valuation Report for This Property
The Home Valuation Report is an in-depth analysis detailing your home's value as well as a comparison with similar homes in the area
Home Values in the Area
Average Home Value in this Area
Purchase History
| Date | Buyer | Sale Price | Title Company |
|---|---|---|---|
| Thomas Christopher Lewis | -- | -- | |
| Thomas Trenda | $6,750 | -- | |
| Thomas Trenda | -- | -- | |
| Hobbs Trenda | $5,000 | -- |
Source: Public Records
Mortgage History
| Date | Status | Borrower | Loan Amount |
|---|---|---|---|
| Open | Thomas Christopher Lewis | $472,000 |
Source: Public Records
Tax History Compared to Growth
Tax History
| Year | Tax Paid | Tax Assessment Tax Assessment Total Assessment is a certain percentage of the fair market value that is determined by local assessors to be the total taxable value of land and additions on the property. | Land | Improvement |
|---|---|---|---|---|
| 2024 | $6,381 | $200,792 | $1,800 | $198,992 |
| 2023 | $5,322 | $166,970 | $1,404 | $165,566 |
| 2022 | $5,148 | $167,162 | $1,404 | $165,758 |
| 2021 | $5,024 | $167,750 | $1,800 | $165,950 |
| 2020 | $4,098 | $131,835 | $1,800 | $130,035 |
| 2019 | $4,126 | $132,776 | $1,800 | $130,976 |
| 2018 | $2,836 | $94,182 | $1,800 | $92,382 |
| 2017 | $258 | $4,130 | $1,800 | $2,330 |
| 2016 | $1,728 | $54,910 | $1,600 | $53,310 |
| 2015 | -- | $54,910 | $1,600 | $53,310 |
| 2013 | -- | $36,723 | $1,400 | $35,323 |
Source: Public Records
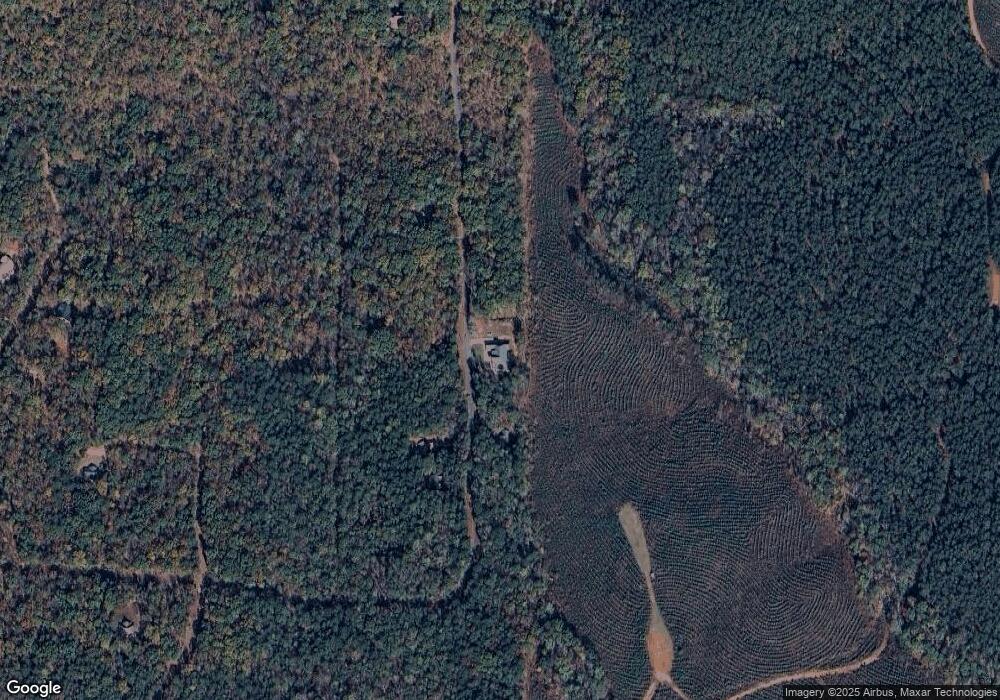
Map
Nearby Homes
- BLK 29 LOT 31 Heather Cir
- 0 Heather Cir Unit 216114
- 6 Juniper Way
- Lot 16 Honeysuckle Cir
- BLK 27 LOT 22 Honeysuckle Cir
- BLOCK 21 LOT 01 Juniper Trail
- BLK 14 LOT 05 Quince Ct
- 0 Aster Ct Block 2 Unit 10540208
- 00Lot3 & Lot 4 Mountain Ridge Dr
- BLK 79 LOT 07 Pansy Loop
- 0 Ingram Rd
- 170 Crabapple Loop
- 0 County Road 58
- 0 S Porter Rd Unit 7609203
- 0 S Porter Rd Unit 10545447
- 9 Oak Ridge Dr
- 11 Oak Ridge Dr
- Lot 18 Oak Ridge Dr
- Lot 4 Oak Ridge Dr
- Lot 4 Oak Ridge Dr Unit 4
- 865 Juniper Trail
- 873 Juniper Trail
- 536 Juniper Trail
- 796 Juniper Trail
- BLK 29 LT 32 33 Heather Cir
- 0 Heather Cir Unit LOT 14 8265024
- 0 Heather Cir Unit LOT 37 8264903
- 0 Heather Cir
- BLK 28 LOT 17 Heather Cir
- BLK 28 LOT 12 Heather Cir
- BLK 24 LOT 16 Juniper Trail
- BLK 29 LOT 16 Heather Cir
- 925 Juniper Trail
- 0 Heather Ln Unit 7 7288004
- 65 Heather Ln
- 453 Honeysuckle Cir
- Lot 6 Juniper Trail
- 511 Juniper Trail
- 376 Honeysuckle Cir
- 505 Honeysuckle Cir