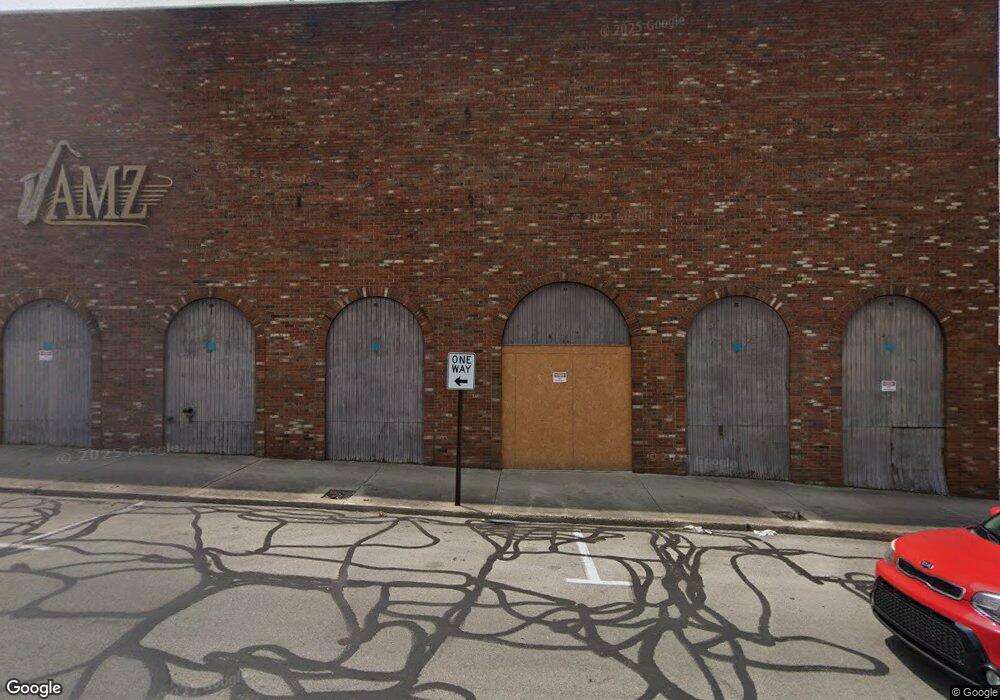
709 Main St Anderson, IN 46016
--
Bed
--
Bath
17,604
Sq Ft
0.58
Acres
About This Home
This home is located at 709 Main St, Anderson, IN 46016. 709 Main St is a home located in Madison County with nearby schools including Eastside Elementary School, Highland Middle School, and Anderson High School.
Ownership History
Date
Name
Owned For
Owner Type
Purchase Details
Closed on
Nov 16, 2020
Sold by
Shadeland Group Llc
Bought by
L3 Investments Llc
Purchase Details
Closed on
Sep 9, 2014
Sold by
Patterson Migual
Bought by
Shadeland Group Llc
Purchase Details
Closed on
Sep 26, 2013
Sold by
Madison County Auditor
Bought by
Patterson Migual
Purchase Details
Closed on
Aug 15, 2005
Sold by
Bullseye Enterprises Inc
Bought by
Quear Linda L
Home Financials for this Owner
Home Financials are based on the most recent Mortgage that was taken out on this home.
Original Mortgage
$126,000
Interest Rate
5.69%
Mortgage Type
Commercial
Create a Home Valuation Report for This Property
The Home Valuation Report is an in-depth analysis detailing your home's value as well as a comparison with similar homes in the area
Home Values in the Area
Average Home Value in this Area
Purchase History
| Date | Buyer | Sale Price | Title Company |
|---|---|---|---|
| L3 Investments Llc | -- | None Available | |
| Shadeland Group Llc | -- | -- | |
| Patterson Migual | -- | -- | |
| Quear Linda L | -- | -- |
Source: Public Records
Mortgage History
| Date | Status | Borrower | Loan Amount |
|---|---|---|---|
| Previous Owner | Quear Linda L | $126,000 |
Source: Public Records
Tax History Compared to Growth
Tax History
| Year | Tax Paid | Tax Assessment Tax Assessment Total Assessment is a certain percentage of the fair market value that is determined by local assessors to be the total taxable value of land and additions on the property. | Land | Improvement |
|---|---|---|---|---|
| 2024 | $2,923 | $90,700 | $21,800 | $68,900 |
| 2023 | $2,936 | $90,700 | $21,800 | $68,900 |
| 2022 | $2,936 | $90,700 | $21,800 | $68,900 |
| 2021 | $2,408 | $74,100 | $21,800 | $52,300 |
| 2020 | $2,415 | $74,100 | $21,800 | $52,300 |
| 2019 | $3,137 | $72,600 | $21,800 | $50,800 |
| 2018 | $4,291 | $72,600 | $21,800 | $50,800 |
| 2017 | $2,130 | $71,000 | $21,800 | $49,200 |
| 2016 | $4,671 | $71,000 | $21,800 | $49,200 |
| 2014 | $2,121 | $70,700 | $21,800 | $48,900 |
| 2013 | $2,121 | $193,900 | $21,800 | $172,100 |
Source: Public Records
Map
Nearby Homes