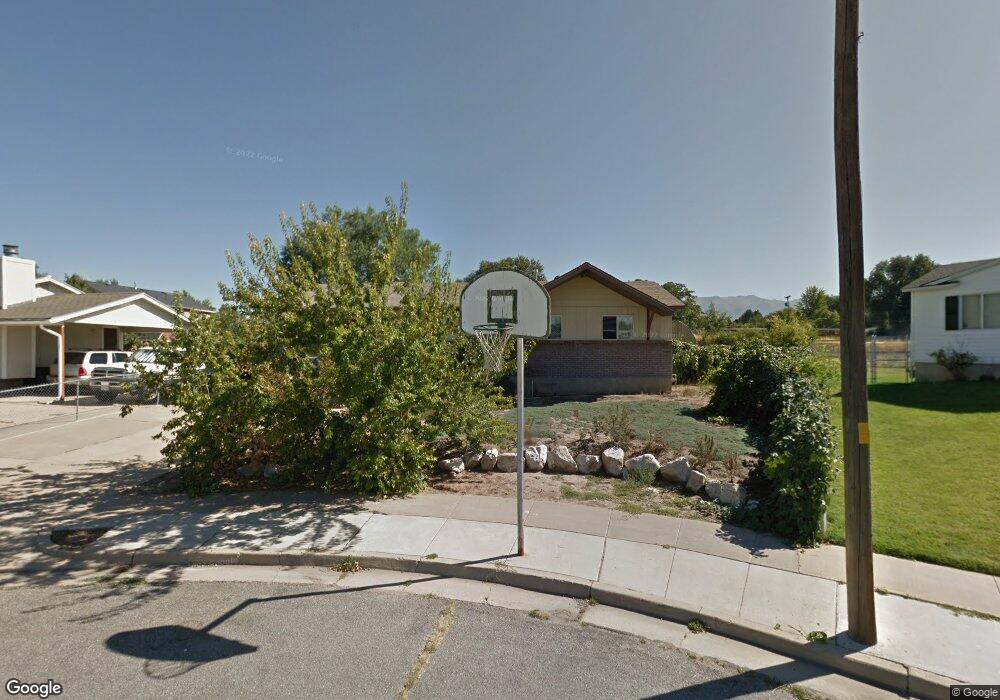
709 N 650 W Clearfield, UT 84015
Estimated Value: $365,000 - $412,070
4
Beds
2
Baths
1,960
Sq Ft
$202/Sq Ft
Est. Value
About This Home
This home is located at 709 N 650 W, Clearfield, UT 84015 and is currently estimated at $396,768, approximately $202 per square foot. 709 N 650 W is a home located in Davis County with nearby schools including Doxey School, North Davis Junior High School, and Clearfield High School.
Ownership History
Date
Name
Owned For
Owner Type
Purchase Details
Closed on
Feb 9, 2015
Sold by
Spangler Carolyn B
Bought by
Lake Andrew B and Lake Amy J
Current Estimated Value
Home Financials for this Owner
Home Financials are based on the most recent Mortgage that was taken out on this home.
Original Mortgage
$5,622
Outstanding Balance
$4,293
Interest Rate
3.76%
Mortgage Type
Stand Alone Second
Estimated Equity
$392,475
Purchase Details
Closed on
Mar 10, 2014
Sold by
Spangler Carolyn B and Yardley Carey Steadman
Bought by
Spangler Carolyn B
Home Financials for this Owner
Home Financials are based on the most recent Mortgage that was taken out on this home.
Original Mortgage
$83,272
Interest Rate
4.29%
Mortgage Type
Purchase Money Mortgage
Purchase Details
Closed on
Mar 12, 2009
Sold by
Spangler Carolyn B
Bought by
Spangler Carolyn B and Yardley Carey Steadman
Create a Home Valuation Report for This Property
The Home Valuation Report is an in-depth analysis detailing your home's value as well as a comparison with similar homes in the area
Home Values in the Area
Average Home Value in this Area
Purchase History
| Date | Buyer | Sale Price | Title Company |
|---|---|---|---|
| Lake Andrew B | -- | Us Title Company O | |
| Spangler Carolyn B | -- | None Available | |
| Spangler Carolyn B | -- | Accommodation |
Source: Public Records
Mortgage History
| Date | Status | Borrower | Loan Amount |
|---|---|---|---|
| Open | Lake Andrew B | $5,622 | |
| Previous Owner | Spangler Carolyn B | $83,272 |
Source: Public Records
Tax History Compared to Growth
Tax History
| Year | Tax Paid | Tax Assessment Tax Assessment Total Assessment is a certain percentage of the fair market value that is determined by local assessors to be the total taxable value of land and additions on the property. | Land | Improvement |
|---|---|---|---|---|
| 2025 | $2,308 | $206,800 | $75,188 | $131,612 |
| 2024 | $2,224 | $200,750 | $71,862 | $128,888 |
| 2023 | $2,076 | $344,000 | $114,709 | $229,291 |
| 2022 | $2,160 | $193,600 | $65,418 | $128,182 |
| 2021 | $1,876 | $254,000 | $71,012 | $182,988 |
| 2020 | $1,621 | $218,000 | $59,995 | $158,005 |
| 2019 | $1,590 | $211,000 | $61,869 | $149,131 |
| 2018 | $1,407 | $182,000 | $54,915 | $127,085 |
| 2016 | $1,147 | $77,550 | $22,033 | $55,517 |
| 2015 | $1,102 | $71,005 | $22,033 | $48,972 |
| 2014 | $1,166 | $76,144 | $22,033 | $54,111 |
| 2013 | -- | $62,214 | $26,730 | $35,484 |
Source: Public Records
Map
Nearby Homes