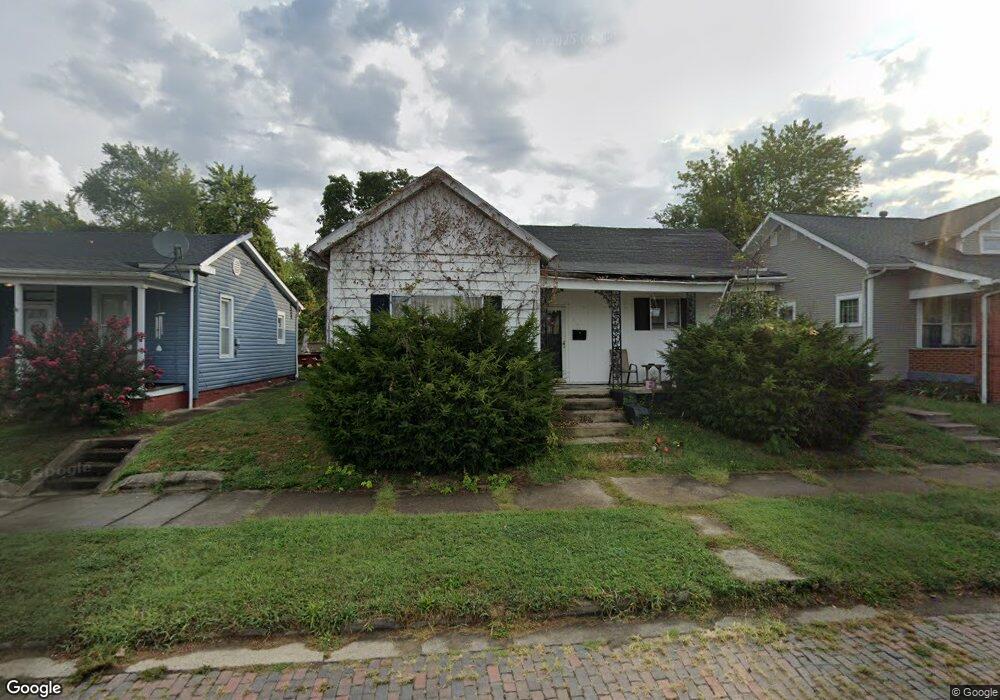
709 N 6th St Ironton, OH 45638
Estimated Value: $68,000 - $116,000
3
Beds
1
Bath
1,581
Sq Ft
$58/Sq Ft
Est. Value
About This Home
This home is located at 709 N 6th St, Ironton, OH 45638 and is currently estimated at $92,247, approximately $58 per square foot. 709 N 6th St is a home located in Lawrence County with nearby schools including Ironton Elementary School, Ironton Middle School, and Ironton High School.
Ownership History
Date
Name
Owned For
Owner Type
Purchase Details
Closed on
Aug 5, 2020
Sold by
Horn John R and Horn Julie A
Bought by
Malone Brittany and Jacobs Donald
Current Estimated Value
Purchase Details
Closed on
Jun 2, 2020
Sold by
2019 Castle Llc
Bought by
Horn John R and Horn Julie A
Home Financials for this Owner
Home Financials are based on the most recent Mortgage that was taken out on this home.
Original Mortgage
$12,800
Interest Rate
3.3%
Mortgage Type
New Conventional
Purchase Details
Closed on
Jan 6, 2020
Sold by
Fhlm
Bought by
2019 Castle Llc
Purchase Details
Closed on
Dec 3, 2019
Sold by
Maines Calra J and Maines Calra J
Bought by
Fhlm
Purchase Details
Closed on
Aug 3, 2004
Sold by
Maines Carl E
Bought by
Maines Carla Jean
Purchase Details
Closed on
Jul 23, 2004
Sold by
Maines Kathryn A
Bought by
Maines Carl E
Purchase Details
Closed on
Jun 10, 1999
Sold by
Harmon David L and Rosema Harmon
Bought by
Maines Kathryn A
Create a Home Valuation Report for This Property
The Home Valuation Report is an in-depth analysis detailing your home's value as well as a comparison with similar homes in the area
Home Values in the Area
Average Home Value in this Area
Purchase History
| Date | Buyer | Sale Price | Title Company |
|---|---|---|---|
| Malone Brittany | $43,000 | None Available | |
| Horn John R | $16,000 | None Available | |
| 2019 Castle Llc | -- | None Available | |
| Fhlm | $31,067 | None Available | |
| Maines Carla Jean | -- | -- | |
| Maines Carl E | -- | -- | |
| Maines Kathryn A | $40,000 | -- |
Source: Public Records
Mortgage History
| Date | Status | Borrower | Loan Amount |
|---|---|---|---|
| Previous Owner | Horn John R | $12,800 |
Source: Public Records
Tax History Compared to Growth
Tax History
| Year | Tax Paid | Tax Assessment Tax Assessment Total Assessment is a certain percentage of the fair market value that is determined by local assessors to be the total taxable value of land and additions on the property. | Land | Improvement |
|---|---|---|---|---|
| 2024 | -- | $28,840 | $7,460 | $21,380 |
| 2023 | $1,043 | $28,840 | $7,460 | $21,380 |
| 2022 | $1,041 | $28,840 | $7,460 | $21,380 |
| 2021 | $903 | $23,430 | $6,730 | $16,700 |
| 2020 | $918 | $23,430 | $6,730 | $16,700 |
| 2019 | $915 | $23,430 | $6,730 | $16,700 |
| 2018 | $572 | $23,430 | $6,730 | $16,700 |
| 2017 | $570 | $23,430 | $6,730 | $16,700 |
| 2016 | $534 | $23,430 | $6,730 | $16,700 |
| 2015 | $440 | $20,370 | $6,730 | $13,640 |
| 2014 | $425 | $20,370 | $6,730 | $13,640 |
| 2013 | $423 | $20,370 | $6,730 | $13,640 |
Source: Public Records
Map
Nearby Homes
- 619 Mill St
- 415 N 7th St
- 717 Buckhorn St
- 922 N 5th St Unit JO10
- 922 N 5th St
- 2213 N 6th St
- 101 S 8th St
- 1310 N 3rd St
- 520 S 10th St
- 605 S 10th St
- 0 Ora Richey Rd
- 1513 Karin St
- 448 Boyd St
- 325 Etna St
- 817 S 4th St
- 914 S 8th St Unit IO-2
- 217 Amanda St
- 717 Chestnut St Unit IO-1
- 228 Etna St
- 721 Chestnut St