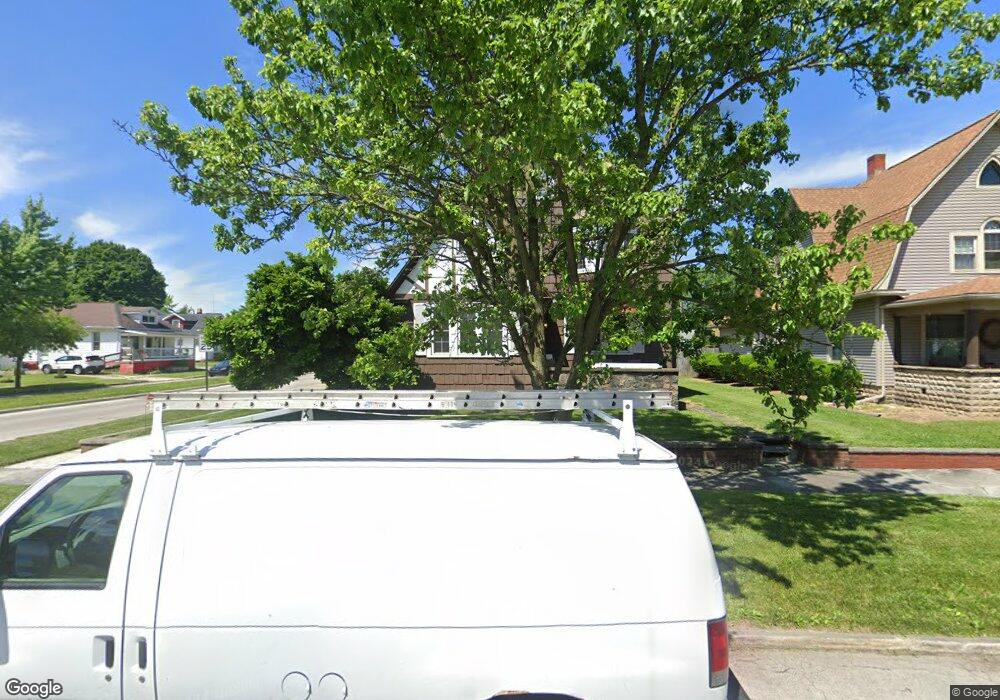
709 N Main St Fostoria, OH 44830
Estimated Value: $68,000 - $104,000
2
Beds
1
Bath
1,560
Sq Ft
$53/Sq Ft
Est. Value
About This Home
This home is located at 709 N Main St, Fostoria, OH 44830 and is currently estimated at $82,550, approximately $52 per square foot. 709 N Main St is a home located in Seneca County with nearby schools including Fostoria Intermediate Elementary School and Fostoria Junior/Senior High School.
Ownership History
Date
Name
Owned For
Owner Type
Purchase Details
Closed on
May 9, 2012
Sold by
Schalk Stephen G
Bought by
Schalk Rentals Llc
Current Estimated Value
Purchase Details
Closed on
Jan 27, 2011
Sold by
Schalk Stepheb G
Bought by
Schalk Rentals Llc
Purchase Details
Closed on
Apr 21, 2008
Sold by
Clouse Amie Jo and Decker Amie Jo Aufdencamp
Bought by
Schalk Stephen G
Purchase Details
Closed on
Nov 18, 1997
Sold by
Aufdencamp Alan Karl
Bought by
Decker Amie Jo Aufdencamp
Create a Home Valuation Report for This Property
The Home Valuation Report is an in-depth analysis detailing your home's value as well as a comparison with similar homes in the area
Home Values in the Area
Average Home Value in this Area
Purchase History
| Date | Buyer | Sale Price | Title Company |
|---|---|---|---|
| Schalk Rentals Llc | -- | None Available | |
| Schalk Rentals Llc | -- | None Available | |
| Schalk Stephen G | $25,000 | Assured Title | |
| Decker Amie Jo Aufdencamp | $15,000 | -- |
Source: Public Records
Tax History Compared to Growth
Tax History
| Year | Tax Paid | Tax Assessment Tax Assessment Total Assessment is a certain percentage of the fair market value that is determined by local assessors to be the total taxable value of land and additions on the property. | Land | Improvement |
|---|---|---|---|---|
| 2024 | $759 | $14,740 | $2,150 | $12,590 |
| 2023 | $760 | $14,740 | $2,150 | $12,590 |
| 2022 | $659 | $11,380 | $2,320 | $9,060 |
| 2021 | $673 | $11,380 | $2,320 | $9,060 |
| 2020 | $676 | $11,386 | $2,324 | $9,062 |
| 2019 | $614 | $10,259 | $2,149 | $8,110 |
| 2018 | $626 | $10,259 | $2,149 | $8,110 |
| 2017 | $626 | $10,259 | $2,149 | $8,110 |
| 2016 | $636 | $11,652 | $2,370 | $9,282 |
| 2015 | $626 | $11,652 | $2,370 | $9,282 |
| 2014 | $597 | $11,652 | $2,370 | $9,282 |
| 2013 | $766 | $13,818 | $2,576 | $11,242 |
Source: Public Records
Map
Nearby Homes
- 633 Maple St
- 211 Summit St
- 540 N Poplar St
- 723 N Union St
- 931 N Union St
- 520 N Union St
- 207 W Culbertson St
- 892 N Countyline St
- 900 N Countyline St
- 827 Buckley St
- 321 Mcdougal St
- 435 Park Ave
- 203 N Union St
- 703 Glenwood Ave
- 711 Circle Dr
- 1324 N Union St
- 603 N Vine St
- 375 Thomas St
- 509 College Ave
- 481 Beverly Dr