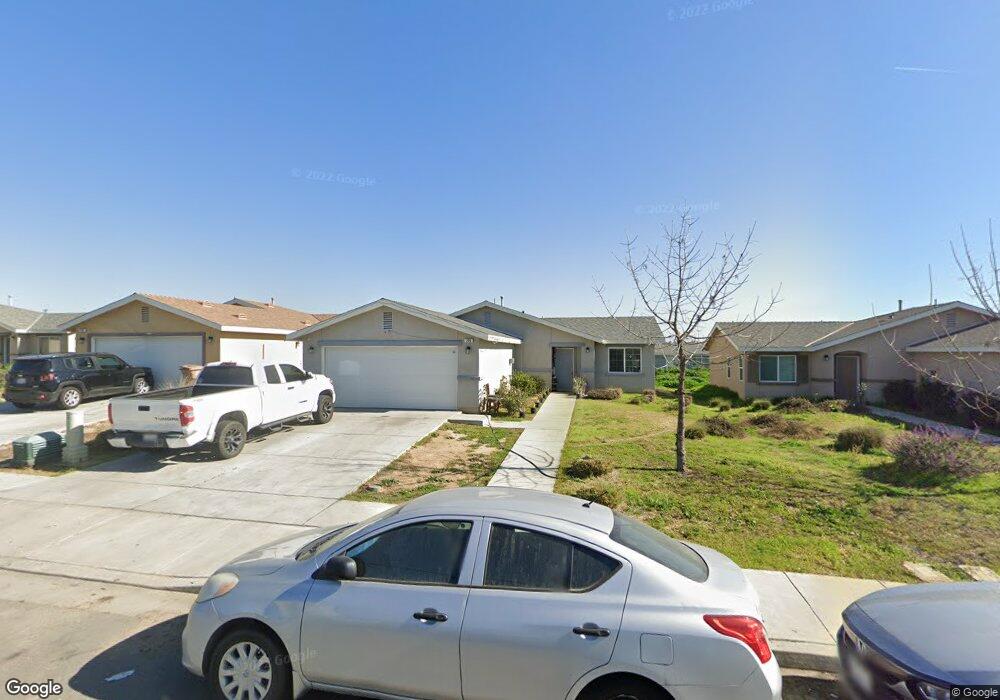
709 Pentz St Bakersfield, CA 93306
West Pioneer Dr NeighborhoodEstimated Value: $249,000 - $332,000
About This Home
This home is located at 709 Pentz St, Bakersfield, CA 93306 and is currently estimated at $281,015, approximately $271 per square foot. 709 Pentz St is a home with nearby schools including Ramon Garza Elementary School, Sierra Middle School, and East Bakersfield High School.
Ownership History
We collect this data history from publicly available records. To have your information removed, we recommend requesting removal directly through your county’s website.
Purchase Details
Home Financials for this Owner
Home Financials are based on the most recent Mortgage that was taken out on this home.Purchase Details
Purchase Details
Home Values in the Area
Average Home Value in this Area
Purchase History
We collect this data history from publicly available records. To have your information removed, we recommend requesting removal directly through your county’s website.
| Date | Buyer | Sale Price | Title Company |
|---|---|---|---|
| $960,000 | Placer Title Company | ||
| $750,000 | None Available | ||
| $458,500 | None Available |
Mortgage History
We collect this data history from publicly available records. To have your information removed, we recommend requesting removal directly through your county’s website.
| Date | Status | Borrower | Loan Amount |
|---|---|---|---|
| Open | $7,935,000 |
Tax History
We collect this data history from publicly available records. To have your information removed, we recommend requesting removal directly through your county’s website.
| Year | Tax Paid | Tax Assessment Tax Assessment Total Assessment is a certain percentage of the fair market value that is determined by local assessors to be the total taxable value of land and additions on the property. | Land | Improvement |
|---|---|---|---|---|
| 2025 | $972 | $140,185 | $33,646 | $106,539 |
| 2024 | $928 | $137,437 | $32,987 | $104,450 |
| 2023 | $928 | $134,743 | $32,341 | $102,402 |
| 2022 | $853 | $132,102 | $31,707 | $100,395 |
| 2021 | $767 | $129,513 | $31,086 | $98,427 |
| 2020 | $705 | $128,186 | $30,768 | $97,418 |
| 2019 | $667 | $128,186 | $30,768 | $97,418 |
| 2018 | $647 | $123,210 | $29,574 | $93,636 |
| 2017 | $630 | $120,795 | $28,995 | $91,800 |
| 2016 | $518 | $118,427 | $28,427 | $90,000 |
| 2015 | $469 | $48,000 | $28,000 | $20,000 |
| 2014 | $141 | $11,495 | $11,495 | $0 |
Map
- 2711 Trust Ave
- 2728 Kentucky St
- 1027 Pentz St
- 2639 Center St
- 2717 Monterey St
- 2915 Edison Hwy
- 2801 Citrus Ave
- 3035 Lake St
- 0 Niles St
- 3101 Pioneer Dr
- 3120 Center St
- 2417 Kentucky St
- 2417 E California Ave
- 2512 Niles St
- 3017 Potomac Ave
- 2636 Victoria Dr
- 603 Hill St
- 2525 Avenida Escuela
- 3224 Kentucky St
- 921 Hill St
- 718 Rembrandt St
- 722 Rembrandt St
- 714 Rembrandt St
- 802 Rembrandt St
- 710 Rembrandt St
- 721 Pentz St
- 725 Pentz St
- 717 Pentz St
- 806 Rembrandt St
- 706 Rembrandt St
- 801 Pentz St
- 713 Pentz St
- 719 Rembrandt St
- 715 Rembrandt St
- 723 Rembrandt St
- 805 Pentz St
- 803 Rembrandt St
- 711 Rembrandt St
- 810 Rembrandt St
- 702 Rembrandt St
Ask me questions while you tour the home.