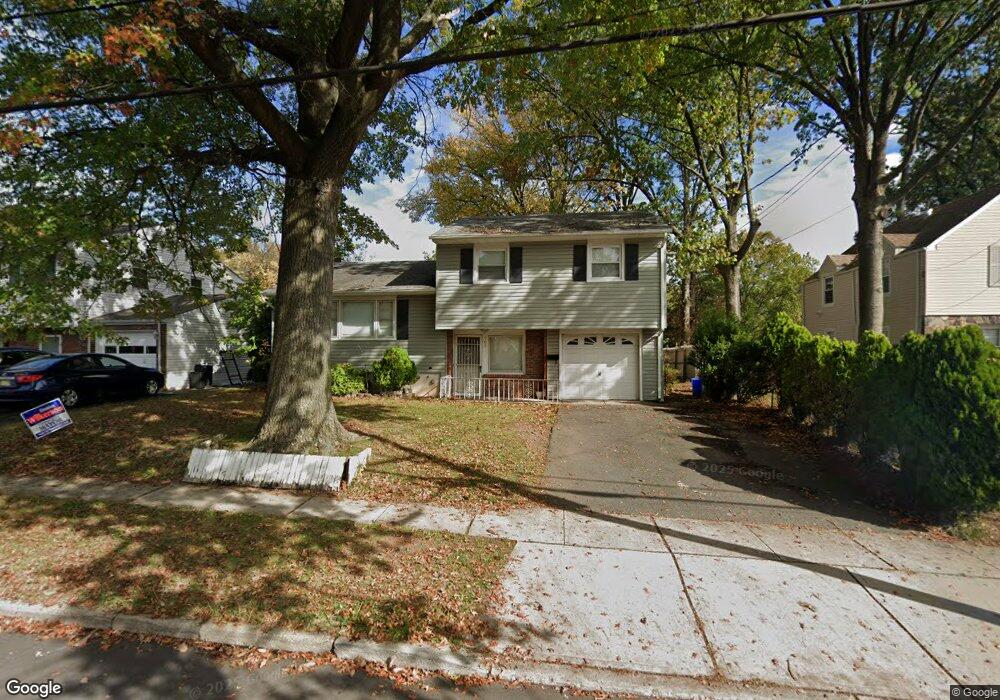
709 Pine St Roselle, NJ 07203
Estimated Value: $414,788 - $555,000
Studio
--
Bath
1,136
Sq Ft
$424/Sq Ft
Est. Value
About This Home
This home is located at 709 Pine St, Roselle, NJ 07203 and is currently estimated at $481,197, approximately $423 per square foot. 709 Pine St is a home located in Union County with nearby schools including Washington Elementary School, Leonard V. Moore Middle School, and Grace Wilday Junior High School.
Ownership History
Date
Name
Owned For
Owner Type
Purchase Details
Closed on
Nov 9, 2009
Sold by
Hsbc Bank Usa
Bought by
Fray Bernard
Current Estimated Value
Home Financials for this Owner
Home Financials are based on the most recent Mortgage that was taken out on this home.
Original Mortgage
$163,719
Interest Rate
4.85%
Mortgage Type
FHA
Purchase Details
Closed on
Nov 27, 2007
Sold by
Rivers Billie L and Rivers Daisy L
Bought by
Hsbc Bank Usa
Create a Home Valuation Report for This Property
The Home Valuation Report is an in-depth analysis detailing your home's value as well as a comparison with similar homes in the area
Home Values in the Area
Average Home Value in this Area
Purchase History
| Date | Buyer | Sale Price | Title Company |
|---|---|---|---|
| Fray Bernard | $150,000 | Multiple | |
| Hsbc Bank Usa | $19,100 | Old Republic Title Insurance |
Source: Public Records
Mortgage History
| Date | Status | Borrower | Loan Amount |
|---|---|---|---|
| Previous Owner | Fray Bernard | $163,719 |
Source: Public Records
Tax History
| Year | Tax Paid | Tax Assessment Tax Assessment Total Assessment is a certain percentage of the fair market value that is determined by local assessors to be the total taxable value of land and additions on the property. | Land | Improvement |
|---|---|---|---|---|
| 2025 | $11,790 | $135,600 | $70,200 | $65,400 |
| 2024 | $11,495 | $135,600 | $70,200 | $65,400 |
| 2023 | $11,495 | $135,600 | $70,200 | $65,400 |
| 2022 | $11,575 | $135,600 | $70,200 | $65,400 |
| 2021 | $11,506 | $135,600 | $70,200 | $65,400 |
| 2020 | $11,469 | $135,600 | $70,200 | $65,400 |
| 2019 | $11,323 | $135,600 | $70,200 | $65,400 |
| 2018 | $11,260 | $135,600 | $70,200 | $65,400 |
| 2017 | $11,201 | $135,600 | $70,200 | $65,400 |
| 2016 | $10,954 | $135,600 | $70,200 | $65,400 |
| 2015 | $10,952 | $135,600 | $70,200 | $65,400 |
| 2014 | $10,647 | $135,600 | $70,200 | $65,400 |
Source: Public Records
Map
Nearby Homes
Your Personal Tour Guide
Ask me questions while you tour the home.