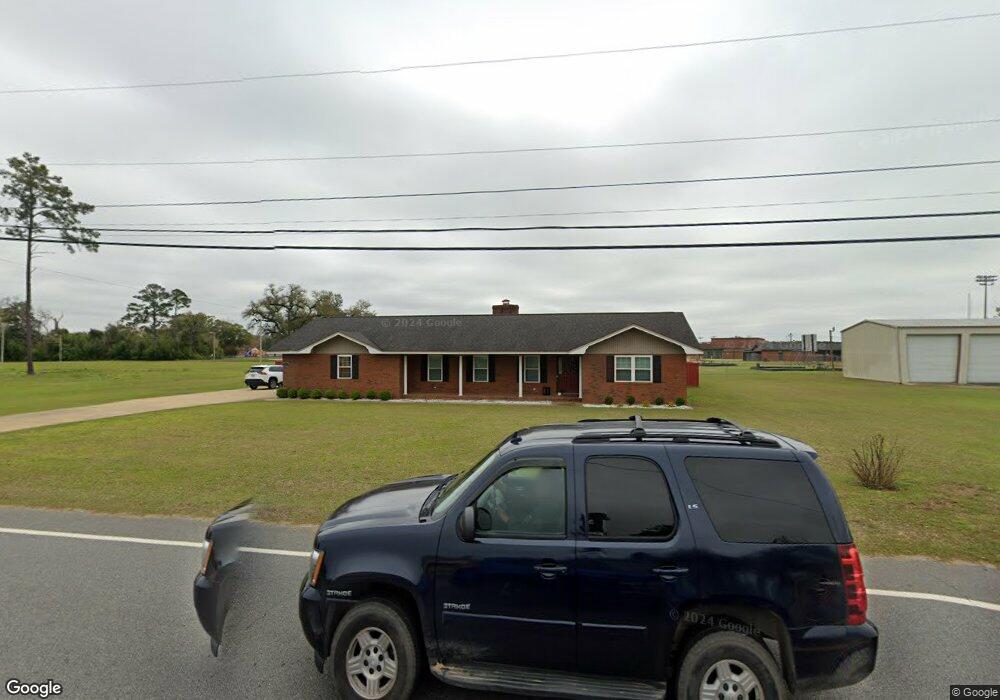
709 S Wiley Ave Donalsonville, GA 39845
Estimated Value: $150,000 - $212,000
--
Bed
2
Baths
1,850
Sq Ft
$98/Sq Ft
Est. Value
About This Home
This home is located at 709 S Wiley Ave, Donalsonville, GA 39845 and is currently estimated at $181,839, approximately $98 per square foot. 709 S Wiley Ave is a home located in Seminole County with nearby schools including Seminole County Elementary School and Seminole County Middle/High School.
Ownership History
Date
Name
Owned For
Owner Type
Purchase Details
Closed on
Oct 8, 2021
Sold by
Jones Kenneth R
Bought by
Coleman Jones Kimberly
Current Estimated Value
Purchase Details
Closed on
Jan 15, 2009
Sold by
Jones Kenneth R
Bought by
Jones Kenneth R and Jones Kimberly Coleman
Home Financials for this Owner
Home Financials are based on the most recent Mortgage that was taken out on this home.
Original Mortgage
$100,325
Interest Rate
5.24%
Mortgage Type
FHA
Purchase Details
Closed on
Feb 7, 2002
Sold by
Jones Kenneth R
Bought by
Jones Kenneth R
Purchase Details
Closed on
Nov 16, 1999
Sold by
Williams Colleen A
Bought by
Jones Kenneth R
Purchase Details
Closed on
Feb 1, 1996
Sold by
Williams Hubert M
Bought by
Williams Colleen A
Purchase Details
Closed on
Apr 12, 1989
Bought by
Williams Hubert M
Create a Home Valuation Report for This Property
The Home Valuation Report is an in-depth analysis detailing your home's value as well as a comparison with similar homes in the area
Home Values in the Area
Average Home Value in this Area
Purchase History
| Date | Buyer | Sale Price | Title Company |
|---|---|---|---|
| Coleman Jones Kimberly | -- | -- | |
| Jones Kenneth R | -- | -- | |
| Jones Kenneth R | -- | -- | |
| Jones Kenneth R | $87,500 | -- | |
| Williams Colleen A | $65,000 | -- | |
| Williams Hubert M | $4,000 | -- |
Source: Public Records
Mortgage History
| Date | Status | Borrower | Loan Amount |
|---|---|---|---|
| Previous Owner | Jones Kenneth R | $100,325 |
Source: Public Records
Tax History Compared to Growth
Tax History
| Year | Tax Paid | Tax Assessment Tax Assessment Total Assessment is a certain percentage of the fair market value that is determined by local assessors to be the total taxable value of land and additions on the property. | Land | Improvement |
|---|---|---|---|---|
| 2024 | $3,055 | $62,058 | $3,080 | $58,978 |
| 2023 | $3,058 | $62,058 | $3,080 | $58,978 |
| 2022 | $1,990 | $62,246 | $3,080 | $59,166 |
| 2021 | $1,657 | $52,033 | $3,080 | $48,953 |
| 2020 | $1,662 | $52,033 | $3,080 | $48,953 |
| 2019 | $1,631 | $51,848 | $3,080 | $48,768 |
| 2018 | $2,537 | $51,848 | $3,080 | $48,768 |
| 2017 | $1,461 | $47,928 | $3,300 | $44,628 |
| 2016 | -- | $48,562 | $3,300 | $45,262 |
| 2015 | -- | $45,454 | $3,300 | $42,154 |
| 2014 | -- | $45,454 | $3,300 | $42,154 |
| 2013 | -- | $43,169 | $3,300 | $39,869 |
Source: Public Records
Map
Nearby Homes
- 508 S Tennille Ave
- 300 W 13th St
- 202 W 4th St
- 403 S Newcombe Ave
- 307 S Morris Ave
- 1203 S Morris Ave
- 816 E 6th St
- lot 565 Martin Dr
- lot 564 Martin Dr
- 5552 Georgia 39
- 210 W Crawford St
- 308 E Carr St
- 601 Ingram St
- 5611 Sweetwater Ave
- 5660 Carter Dr
- 1068 Georgia 39
- 000 Hagen Still Rd
- 000 Hagen Still Rd
- 394 Bush Dairy Rd
- 0 Hagen-Still Rd
- 803 S Wiley Ave
- 800 S Wiley Ave
- 901 S Wiley Ave
- 902 S Wiley Ave
- 905 S Wiley Ave
- 700 S Wiley Ave
- 105 W 7th St
- 900 S Wiley Ave
- 111 E 7th St
- 102 E 7th St
- 1003 S Wiley Ave
- 104 W 10th St
- 104 E 7th St
- 800 Marianna Hwy
- 107 W 7th St
- 106 W 10th St
- 1000 S Wiley Ave
- 610 S Woolfork Ave
- 108 E 7th St
- 104 W 7th St