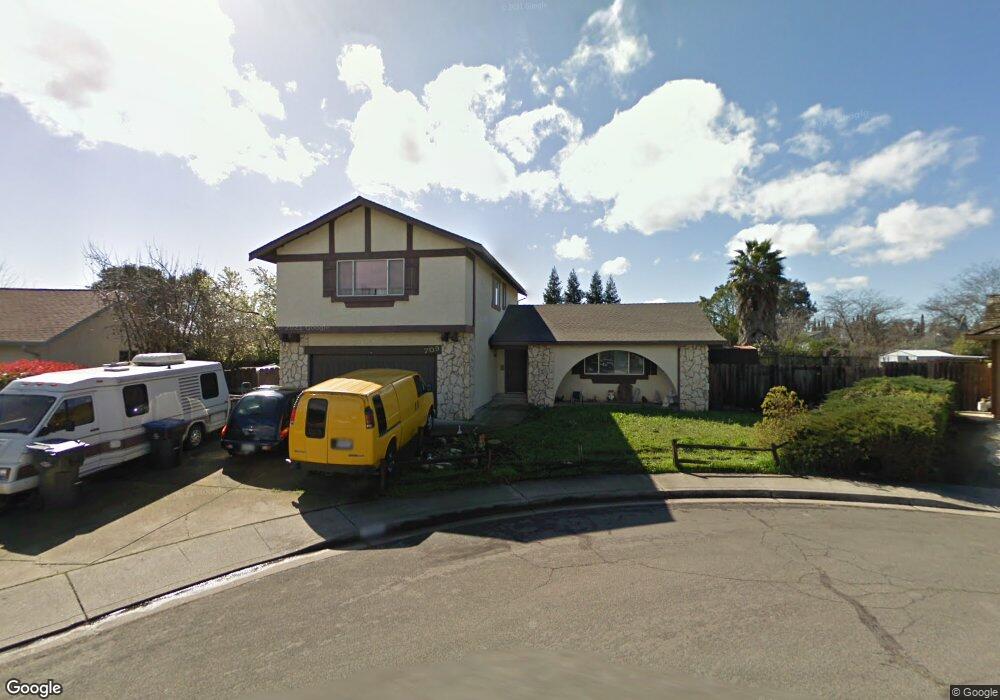
709 Shamrock Ct Fairfield, CA 94533
Estimated Value: $611,000 - $647,000
About This Home
This home is located at 709 Shamrock Ct, Fairfield, CA 94533 and is currently estimated at $630,166, approximately $307 per square foot. 709 Shamrock Ct is a home located in Solano County with nearby schools including Laurel Creek Elementary School, Grange Middle School, and Fairfield High School.
Ownership History
We collect this data history from publicly available records. To have your information removed, we recommend requesting removal directly through your county’s website.
Purchase Details
Home Financials for this Owner
Home Financials are based on the most recent Mortgage that was taken out on this home.Purchase Details
Home Financials for this Owner
Home Financials are based on the most recent Mortgage that was taken out on this home.Home Values in the Area
Average Home Value in this Area
Purchase History
We collect this data history from publicly available records. To have your information removed, we recommend requesting removal directly through your county’s website.
| Date | Buyer | Sale Price | Title Company |
|---|---|---|---|
| $410,000 | Old Republic Title Company | ||
| $225,000 | First American Title Company |
Mortgage History
We collect this data history from publicly available records. To have your information removed, we recommend requesting removal directly through your county’s website.
| Date | Status | Borrower | Loan Amount |
|---|---|---|---|
| Open | $396,316 | ||
| Previous Owner | $219,296 |
Tax History
We collect this data history from publicly available records. To have your information removed, we recommend requesting removal directly through your county’s website.
| Year | Tax Paid | Tax Assessment Tax Assessment Total Assessment is a certain percentage of the fair market value that is determined by local assessors to be the total taxable value of land and additions on the property. | Land | Improvement |
|---|---|---|---|---|
| 2025 | $5,342 | $485,348 | $94,699 | $390,649 |
| 2024 | $5,342 | $475,833 | $92,843 | $382,990 |
| 2023 | $5,176 | $466,504 | $91,023 | $375,481 |
| 2022 | $5,112 | $457,358 | $89,239 | $368,119 |
| 2021 | $5,060 | $448,391 | $87,490 | $360,901 |
| 2020 | $4,940 | $443,794 | $86,593 | $357,201 |
| 2019 | $4,817 | $435,094 | $84,896 | $350,198 |
| 2018 | $4,971 | $426,564 | $83,232 | $343,332 |
| 2017 | $4,739 | $418,200 | $81,600 | $336,600 |
| 2016 | $2,770 | $243,506 | $64,934 | $178,572 |
| 2015 | $2,584 | $239,849 | $63,959 | $175,890 |
| 2014 | $2,559 | $235,152 | $62,707 | $172,445 |
Map
- 3012 Chestnut Ct
- 2924 Redwood Dr
- 445 Lakehurst Ct
- 2909 Gulf Dr
- 760 Normandy Ct
- 772 Largo Ct
- 2456 Shore Vista
- 3012 Evergreen Dr
- 500 Asbury Ln
- 989 Suffolk Way
- 3045 Waring Place
- 2827 Sunburst Dr
- 443 Hartwick Ln
- 2438 Oceanic Dr
- 738 Marsh Place
- 2496 E Atlantic Ave
- 2420 Oceanic Dr
- 3211 Avenido Del Lago Way
- 2915 N Texas St Unit 153
- 2915 N Texas St Unit 148
- 710 Rosemary Ct
- 707 Magnolia Ct
- 704 Rosemary Ct
- 716 Rosemary Ct
- 701 Magnolia Ct
- 713 Magnolia Ct
- 703 Rosemary Ct
- 709 Rosemary Ct
- 719 Magnolia Ct
- 715 Rosemary Ct
- 700 Magnolia Ct
- 728 Rosemary Ct
- 721 Rosemary Ct
- 725 Magnolia Ct
- 3020 Marbury Ct
- 3014 Marbury Ct
- 706 Magnolia Ct
- 3026 Marbury Ct
- 712 Magnolia Ct
- 3008 Marbury Ct
Ask me questions while you tour the home.