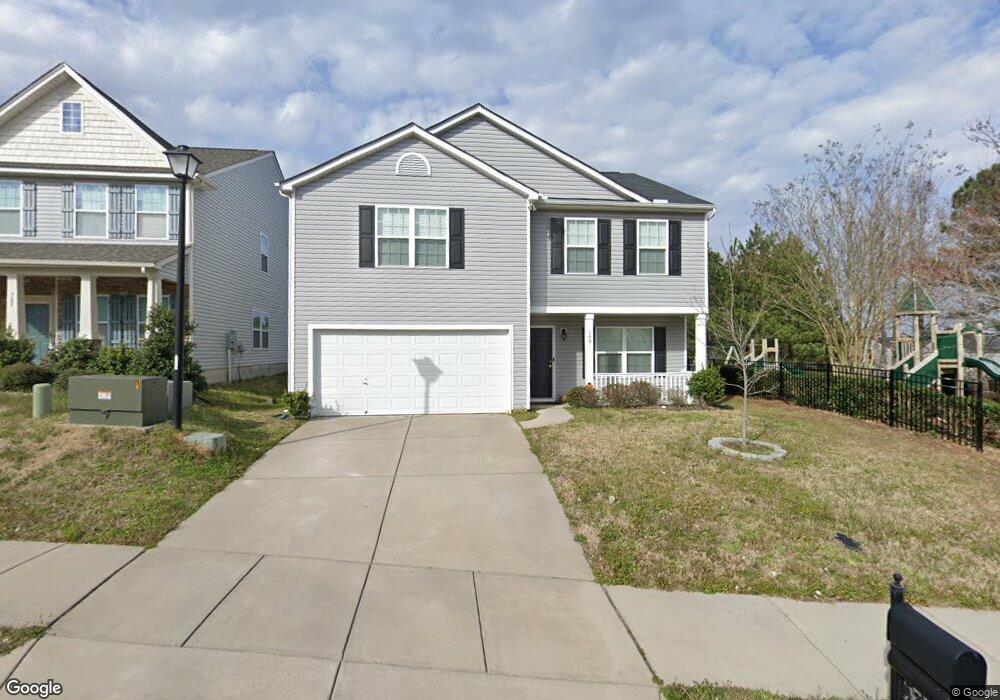
709 Shellbark Dr Unit 91A Concord, NC 28025
Estimated Value: $295,000 - $365,000
4
Beds
3
Baths
2,231
Sq Ft
$151/Sq Ft
Est. Value
About This Home
This home is located at 709 Shellbark Dr Unit 91A, Concord, NC 28025 and is currently estimated at $337,234, approximately $151 per square foot. 709 Shellbark Dr Unit 91A is a home located in Cabarrus County with nearby schools including Rocky River Elementary School, C.C. Griffin Middle School, and Central Cabarrus High School.
Ownership History
Date
Name
Owned For
Owner Type
Purchase Details
Closed on
Mar 1, 2014
Sold by
D R Horton Regent Llc
Bought by
Bowman Michael and Bowman Amanda
Current Estimated Value
Home Financials for this Owner
Home Financials are based on the most recent Mortgage that was taken out on this home.
Original Mortgage
$100,826
Interest Rate
4.37%
Mortgage Type
New Conventional
Purchase Details
Closed on
Sep 12, 2013
Sold by
Nw Southeast Holdings Llc
Bought by
Regent Homes Inc
Home Financials for this Owner
Home Financials are based on the most recent Mortgage that was taken out on this home.
Original Mortgage
$3,000,000
Interest Rate
4.39%
Mortgage Type
Purchase Money Mortgage
Purchase Details
Closed on
Sep 14, 2010
Sold by
Hallstead Homeowners Association Inc
Bought by
Morrison Creek Llc
Create a Home Valuation Report for This Property
The Home Valuation Report is an in-depth analysis detailing your home's value as well as a comparison with similar homes in the area
Home Values in the Area
Average Home Value in this Area
Purchase History
| Date | Buyer | Sale Price | Title Company |
|---|---|---|---|
| Bowman Michael | $131,000 | None Available | |
| Regent Homes Inc | $24,000 | None Available | |
| Morrison Creek Llc | -- | None Available |
Source: Public Records
Mortgage History
| Date | Status | Borrower | Loan Amount |
|---|---|---|---|
| Previous Owner | Bowman Michael | $100,826 | |
| Previous Owner | Regent Homes Inc | $3,000,000 |
Source: Public Records
Tax History
| Year | Tax Paid | Tax Assessment Tax Assessment Total Assessment is a certain percentage of the fair market value that is determined by local assessors to be the total taxable value of land and additions on the property. | Land | Improvement |
|---|---|---|---|---|
| 2025 | $3,187 | $320,020 | $70,000 | $250,020 |
| 2024 | $3,187 | $320,020 | $70,000 | $250,020 |
| 2023 | $2,589 | $212,200 | $45,000 | $167,200 |
| 2022 | $2,589 | $212,200 | $45,000 | $167,200 |
| 2021 | $2,589 | $212,200 | $45,000 | $167,200 |
| 2020 | $2,589 | $212,200 | $45,000 | $167,200 |
| 2019 | $2,051 | $168,100 | $20,000 | $148,100 |
| 2018 | $2,017 | $168,100 | $20,000 | $148,100 |
| 2017 | $1,975 | $167,390 | $20,000 | $147,390 |
| 2016 | $1,172 | $144,200 | $20,000 | $124,200 |
| 2015 | -- | $56,710 | $20,000 | $36,710 |
| 2014 | -- | $56,710 | $20,000 | $36,710 |
Source: Public Records
Map
Nearby Homes
- 741 Nannyberry Ln
- 4003 Long Arrow Dr Unit 366
- 4018 Bethesda Place
- 1039 Manston Place SW
- 608 Nannyberry Ln
- 4194 Clifftonville Ave SW
- 303 Olde North Church Dr Unit 38
- 685 Continental Dr
- 836 Chastain Ave
- 1308 Roseberry Place SW
- 3560 Us Highway 601 S
- 1009 Braxton Dr
- 3044 Parade Ln SW
- 3168 Sossamon Place
- 847 Kathryn Dr SE
- 1234 Piney Church Rd
- 4227 Kiser Woods Dr SW
- 3560-C U S 601
- 518 Viking Place SW
- 3043 Talledaga Ln SW
- 709 Shellbark Dr
- 701 Shellbark Dr
- 784 Bartram Ave
- 786 Bartram Ave
- 3962 Tallowtree Ln
- 697 Shellbark Dr
- 780 Bartram Ave
- 776 Bartram Ave
- 700 Shellbark Dr
- 693 Shellbark Dr
- 693 Shellbark Dr Unit 95
- 3966 Tallowtree Ln
- 772 Bartram Ave
- 801 Shellbark Dr
- 3967 Long Leaf Ct
- 794 Bartram Ave
- 689 Shellbark Dr
- 696 Shellbark Dr
- 3970 Tallowtree Ln
- 3971 Long Leaf Ct
Your Personal Tour Guide
Ask me questions while you tour the home.