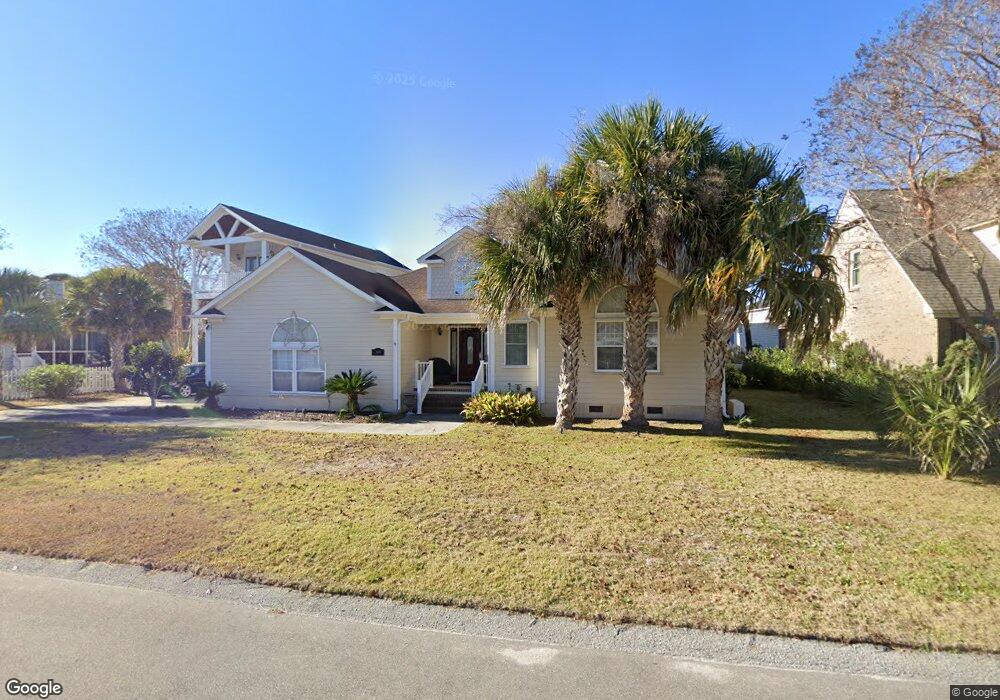
709 Sloop Pointe Ln Kure Beach, NC 28449
Estimated Value: $627,000 - $761,836
3
Beds
3
Baths
2,323
Sq Ft
$308/Sq Ft
Est. Value
About This Home
This home is located at 709 Sloop Pointe Ln, Kure Beach, NC 28449 and is currently estimated at $714,709, approximately $307 per square foot. 709 Sloop Pointe Ln is a home located in New Hanover County with nearby schools including Carolina Beach Elementary School, Charles P. Murray Middle School, and Eugene Ashley High School.
Ownership History
Date
Name
Owned For
Owner Type
Purchase Details
Closed on
Sep 22, 2006
Sold by
Petry Doraine
Bought by
Copenhaver Arlen Brent and Lynne Copenhaver B
Current Estimated Value
Home Financials for this Owner
Home Financials are based on the most recent Mortgage that was taken out on this home.
Original Mortgage
$304,000
Outstanding Balance
$181,067
Interest Rate
6.52%
Mortgage Type
Purchase Money Mortgage
Estimated Equity
$533,642
Purchase Details
Closed on
Oct 24, 1996
Sold by
Patton Willard E Belva G
Bought by
Petry Leo H Doraine
Purchase Details
Closed on
Dec 30, 1993
Sold by
Gulf Stream Developers Inc
Bought by
Patton Willard E Belva G
Purchase Details
Closed on
Oct 19, 1992
Sold by
Peoples Federal Savings Bank
Bought by
Gulf Stream Developers Inc
Create a Home Valuation Report for This Property
The Home Valuation Report is an in-depth analysis detailing your home's value as well as a comparison with similar homes in the area
Home Values in the Area
Average Home Value in this Area
Purchase History
| Date | Buyer | Sale Price | Title Company |
|---|---|---|---|
| Copenhaver Arlen Brent | $380,000 | None Available | |
| Petry Leo H Doraine | $180,000 | -- | |
| Patton Willard E Belva G | $45,000 | -- | |
| Gulf Stream Developers Inc | $2,000,000 | -- |
Source: Public Records
Mortgage History
| Date | Status | Borrower | Loan Amount |
|---|---|---|---|
| Open | Copenhaver Arlen Brent | $304,000 |
Source: Public Records
Tax History
| Year | Tax Paid | Tax Assessment Tax Assessment Total Assessment is a certain percentage of the fair market value that is determined by local assessors to be the total taxable value of land and additions on the property. | Land | Improvement |
|---|---|---|---|---|
| 2025 | $3,912 | $818,400 | $429,500 | $388,900 |
| 2024 | $3,701 | $500,200 | $214,600 | $285,600 |
| 2023 | $3,580 | $500,200 | $214,600 | $285,600 |
| 2022 | $3,605 | $500,200 | $214,600 | $285,600 |
| 2021 | $3,705 | $500,200 | $214,600 | $285,600 |
| 2020 | $3,572 | $399,100 | $178,100 | $221,000 |
| 2019 | $3,572 | $399,100 | $178,100 | $221,000 |
| 2018 | $3,532 | $399,100 | $178,100 | $221,000 |
| 2017 | $3,412 | $399,100 | $178,100 | $221,000 |
| 2016 | $3,755 | $413,500 | $144,300 | $269,200 |
| 2015 | $3,455 | $413,500 | $144,300 | $269,200 |
| 2014 | $3,372 | $413,500 | $144,300 | $269,200 |
Source: Public Records
Map
Nearby Homes
- 718 Sloop Pointe Ln
- 734 Cutter Ct
- 130 Heather Ln
- 765 Sloop Pointe Ln
- 221 Seawatch Way Unit LT5050
- 717 Settlers Ln
- 305 Kure Village Way
- 129 Seawatch Way
- 114 Leeward Ct
- 745 Settlers Ln
- 822 Cutter Ct
- 737 Fort Fisher Blvd N
- 192 Seawatch Way
- 509 Seahorse Place
- 402 Fort Fisher Blvd N
- 116 Myrtle Ave
- 124 Ocean View Ave
- 465 Fort Fisher Blvd N
- 113 Ocean View Ave
- 115 Hanby Ave Unit B
- 717 Sloop Pointe Ln
- 710 Sailor Ct
- 806 Kure Village Way
- 802 Kure Village Way
- 810 Kure Village Way
- 714 Sailor Ct
- 714 Sloop Pointe Ln
- 721 Sloop Pointe Ln
- 710 Sloop Pointe Ln
- 706 Sloop Pointe Ln
- 718 Sailor Ct
- 722 Sloop Pointe Ln Unit 44R
- 725 Sloop Pointe Ln
- 702 Sloop Pointe Ln
- 737 Sailor Ct
- 321 Sealane Way
- 726 Sloop Pointe Ln
- 722 Sailor Ct
- 325 Sealane Way
- 717 Sailor Ct
Your Personal Tour Guide
Ask me questions while you tour the home.