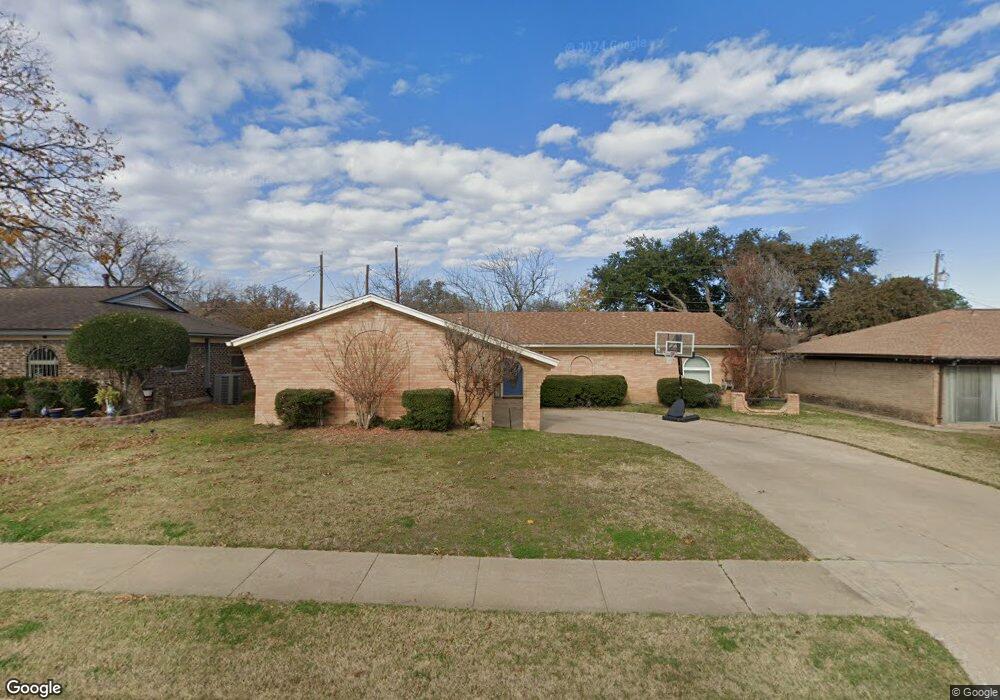
709 Spring Garden Dr Bedford, TX 76021
Estimated Value: $348,393 - $378,000
3
Beds
2
Baths
1,752
Sq Ft
$205/Sq Ft
Est. Value
About This Home
This home is located at 709 Spring Garden Dr, Bedford, TX 76021 and is currently estimated at $359,348, approximately $205 per square foot. 709 Spring Garden Dr is a home located in Tarrant County with nearby schools including Bedford Heights Elementary School, Bedford Junior High School, and L.D. Bell High School.
Ownership History
Date
Name
Owned For
Owner Type
Purchase Details
Closed on
Sep 23, 2016
Sold by
Dibs Us Inc
Bought by
Dash Amit K and Juneja Shiksha
Current Estimated Value
Home Financials for this Owner
Home Financials are based on the most recent Mortgage that was taken out on this home.
Original Mortgage
$180,500
Outstanding Balance
$144,269
Interest Rate
3.45%
Mortgage Type
New Conventional
Estimated Equity
$215,079
Purchase Details
Closed on
Nov 20, 2015
Sold by
Smith Jeffery and Smith Crystal
Bought by
Dibs Us Inc
Purchase Details
Closed on
Dec 15, 2003
Sold by
Mcallister Tami
Bought by
Smith Jeffery and Smith Crystal
Home Financials for this Owner
Home Financials are based on the most recent Mortgage that was taken out on this home.
Original Mortgage
$142,871
Interest Rate
5.97%
Mortgage Type
FHA
Purchase Details
Closed on
Aug 26, 1993
Sold by
Easley Mark
Bought by
Mcallister Tami
Home Financials for this Owner
Home Financials are based on the most recent Mortgage that was taken out on this home.
Original Mortgage
$73,748
Interest Rate
7.18%
Mortgage Type
FHA
Create a Home Valuation Report for This Property
The Home Valuation Report is an in-depth analysis detailing your home's value as well as a comparison with similar homes in the area
Home Values in the Area
Average Home Value in this Area
Purchase History
| Date | Buyer | Sale Price | Title Company |
|---|---|---|---|
| Dash Amit K | -- | Attorney | |
| Dibs Us Inc | -- | None Available | |
| Smith Jeffery | -- | -- | |
| Mcallister Tami | -- | Trinity Western Title Co |
Source: Public Records
Mortgage History
| Date | Status | Borrower | Loan Amount |
|---|---|---|---|
| Open | Dash Amit K | $180,500 | |
| Previous Owner | Smith Jeffery | $142,871 | |
| Previous Owner | Mcallister Tami | $73,748 |
Source: Public Records
Tax History Compared to Growth
Tax History
| Year | Tax Paid | Tax Assessment Tax Assessment Total Assessment is a certain percentage of the fair market value that is determined by local assessors to be the total taxable value of land and additions on the property. | Land | Improvement |
|---|---|---|---|---|
| 2025 | $5,274 | $251,000 | $75,000 | $176,000 |
| 2024 | $5,274 | $270,876 | $75,000 | $195,876 |
| 2023 | $5,661 | $295,178 | $40,000 | $255,178 |
| 2022 | $5,402 | $250,000 | $40,000 | $210,000 |
| 2021 | $5,296 | $224,846 | $40,000 | $184,846 |
| 2020 | $5,346 | $224,846 | $40,000 | $184,846 |
| 2019 | $5,585 | $235,000 | $40,000 | $195,000 |
| 2018 | $4,695 | $209,000 | $40,000 | $169,000 |
| 2017 | $4,596 | $190,000 | $28,000 | $162,000 |
| 2016 | $3,792 | $175,000 | $28,000 | $147,000 |
| 2015 | $3,304 | $142,500 | $15,000 | $127,500 |
| 2014 | $3,304 | $142,500 | $15,000 | $127,500 |
Source: Public Records
Map
Nearby Homes
- 3213 Spring Valley Dr
- 3119 Spring Grove Dr
- 801 Shady Creek Ln
- 913 Kensington Ct
- 922 Shady Creek Ln
- 3605 Spring Valley Dr
- 320 Blue Quail Ct
- 1013 Springdale Rd
- 3609 Wayne Ct
- 2704 Shady Grove Dr
- 817 Shady Lake Dr
- 432 Sunnybrook Ct
- 2700 Shady Grove Dr
- 305 Warbler Dr
- 3624 Wayne Ct
- 405 Woodbriar Ct
- 2501 Shady Grove Dr
- 2436 Brookgreen Ct
- 909 Brestol Ct W
- 2508 Lakeview Dr
- 713 Spring Garden Dr
- 705 Spring Garden Dr
- 704 Spring Lake Dr
- 708 Spring Lake Dr
- 717 Spring Garden Dr
- 701 Spring Garden Dr
- 700 Spring Lake Dr
- 712 Spring Lake Dr
- 708 Spring Garden Dr
- 704 Spring Garden Dr
- 712 Spring Garden Dr
- 620 Spring Lake Dr
- 721 Spring Garden Dr
- 621 Spring Garden Dr
- 700 Spring Garden Dr
- 716 Spring Garden Dr
- 716 Spring Lake Dr
- 616 Spring Lake Dr
- 620 Spring Garden Dr
- 720 Spring Garden Dr