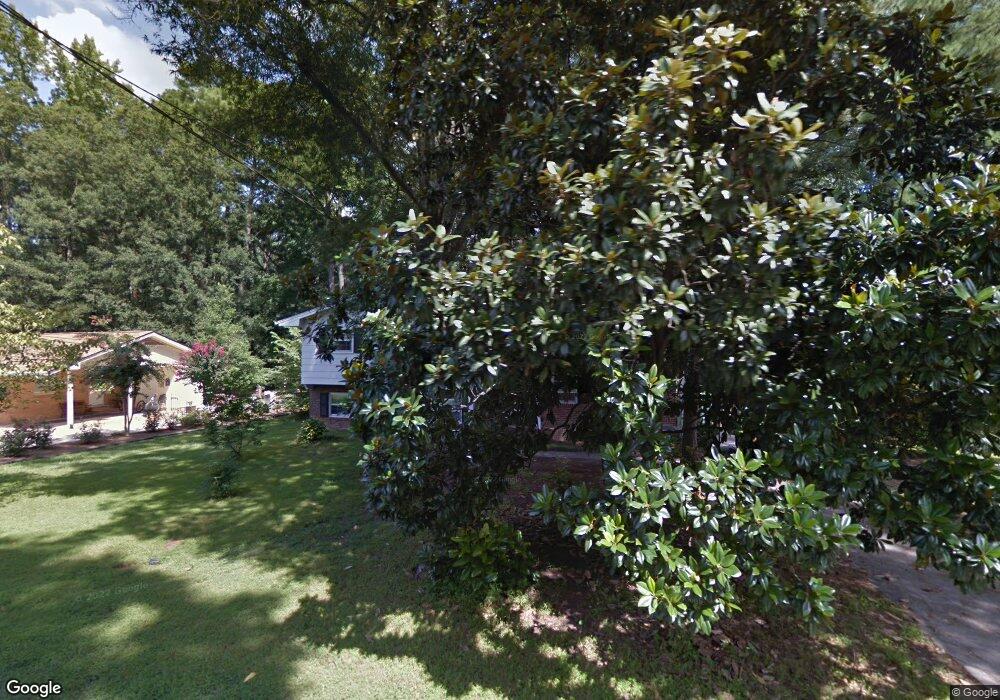
709 Spring St Cary, NC 27511
South Cary NeighborhoodEstimated Value: $475,000 - $569,000
4
Beds
2
Baths
1,740
Sq Ft
$295/Sq Ft
Est. Value
About This Home
This home is located at 709 Spring St, Cary, NC 27511 and is currently estimated at $512,684, approximately $294 per square foot. 709 Spring St is a home located in Wake County with nearby schools including Cary Elementary, East Cary Middle School, and Cary High School.
Ownership History
Date
Name
Owned For
Owner Type
Purchase Details
Closed on
Sep 5, 2018
Sold by
Wagner John David
Bought by
Porter Charles E and Porter Rachel A King
Current Estimated Value
Home Financials for this Owner
Home Financials are based on the most recent Mortgage that was taken out on this home.
Original Mortgage
$120,000
Outstanding Balance
$73,893
Interest Rate
4.5%
Mortgage Type
New Conventional
Estimated Equity
$438,791
Purchase Details
Closed on
Jun 12, 2016
Sold by
Wagner Julia Matson
Bought by
Wagner John David
Purchase Details
Closed on
Jun 13, 2009
Sold by
Threewitts Doris H and Threewitts Doris S
Bought by
Matson Julia
Home Financials for this Owner
Home Financials are based on the most recent Mortgage that was taken out on this home.
Original Mortgage
$132,000
Interest Rate
4.77%
Mortgage Type
New Conventional
Create a Home Valuation Report for This Property
The Home Valuation Report is an in-depth analysis detailing your home's value as well as a comparison with similar homes in the area
Home Values in the Area
Average Home Value in this Area
Purchase History
| Date | Buyer | Sale Price | Title Company |
|---|---|---|---|
| Porter Charles E | $270,000 | None Available | |
| Wagner John David | -- | None Available | |
| Matson Julia | $165,000 | None Available |
Source: Public Records
Mortgage History
| Date | Status | Borrower | Loan Amount |
|---|---|---|---|
| Open | Porter Charles E | $120,000 | |
| Previous Owner | Matson Julia | $132,000 |
Source: Public Records
Tax History
| Year | Tax Paid | Tax Assessment Tax Assessment Total Assessment is a certain percentage of the fair market value that is determined by local assessors to be the total taxable value of land and additions on the property. | Land | Improvement |
|---|---|---|---|---|
| 2025 | $4,056 | $470,839 | $290,000 | $180,839 |
| 2024 | $3,968 | $470,839 | $290,000 | $180,839 |
Source: Public Records
Map
Nearby Homes
- 711 Kildaire Farm Rd
- 213 Dowell Dr
- 603 Kildaire Farm Rd Unit 603-605
- 111 E Cornwall Rd
- 905 Ball Field Aly Unit 102
- 905 Ball Field Aly Unit 303
- 109 Forest Green Dr
- 802 Warren Ave
- 115 Forest Green Dr
- 110 Byrum St Unit 108
- 110 Byrum St Unit 303
- 110 Byrum St Unit 308
- 110 Byrum St Unit 305
- 110 Byrum St Unit 101
- 110 Byrum St Unit 304
- 110 Byrum St Unit 104
- 110 Byrum St Unit 107
- 110 Byrum St Unit 307
- 110 Byrum St Unit 106
- 110 Byrum St Unit 105
- 705 Spring St
- 713 Spring St
- 710 Austin Ave
- 708 Austin Ave
- 708 Austin Ave Unit (UnitID 12733854)
- 715 Spring St
- 716 Austin Ave
- 128 Dowell Dr
- 102 Kinsey Cir
- 704 Spring St
- 706 Austin Ave
- 719 Spring St
- 720 Austin Ave
- 118 Dowell Dr
- 112 Kinsey Cir
- 702 Austin Ave
- 121 Meadow Dr
- 129 Meadow Dr
- 718 Spring St
- 709 Austin Ave
Your Personal Tour Guide
Ask me questions while you tour the home.