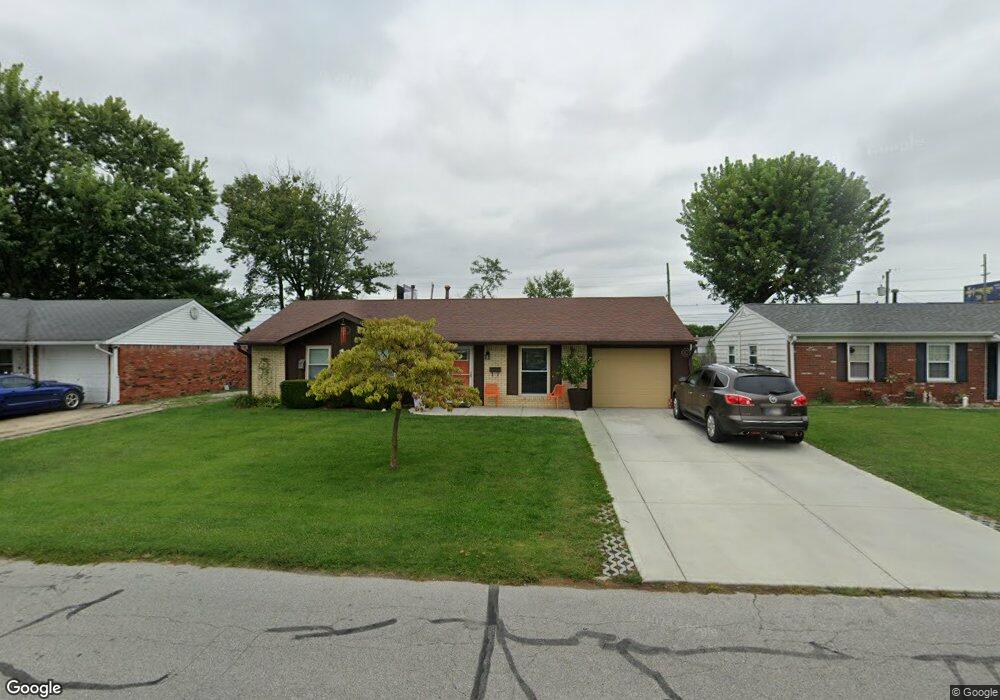
709 Sweetbriar Ave Whiteland, IN 46184
Estimated Value: $198,000 - $213,839
3
Beds
1
Bath
1,194
Sq Ft
$174/Sq Ft
Est. Value
About This Home
This home is located at 709 Sweetbriar Ave, Whiteland, IN 46184 and is currently estimated at $207,210, approximately $173 per square foot. 709 Sweetbriar Ave is a home located in Johnson County with nearby schools including Break-O-Day Elementary School, Clark-Pleasant Middle School, and Whiteland Community High School.
Ownership History
Date
Name
Owned For
Owner Type
Purchase Details
Closed on
Nov 25, 2009
Sold by
Harbin Danny and Harbin Jennifer
Bought by
Mcclintic Lynette R
Current Estimated Value
Home Financials for this Owner
Home Financials are based on the most recent Mortgage that was taken out on this home.
Original Mortgage
$76,948
Outstanding Balance
$50,728
Interest Rate
5.11%
Mortgage Type
FHA
Estimated Equity
$156,482
Purchase Details
Closed on
Feb 4, 2009
Sold by
Wells Fargo Bank Na
Bought by
Harbin Danny and Harbin Jennifer
Purchase Details
Closed on
Aug 21, 2008
Sold by
Brown Thomas J and Myars Lennis R
Bought by
Wells Fargo Bank Na
Purchase Details
Closed on
Apr 29, 2005
Sold by
Walls Gordon D and Walls Kenda M
Bought by
Brown Thomas J
Home Financials for this Owner
Home Financials are based on the most recent Mortgage that was taken out on this home.
Original Mortgage
$67,600
Interest Rate
6.89%
Mortgage Type
Adjustable Rate Mortgage/ARM
Create a Home Valuation Report for This Property
The Home Valuation Report is an in-depth analysis detailing your home's value as well as a comparison with similar homes in the area
Home Values in the Area
Average Home Value in this Area
Purchase History
| Date | Buyer | Sale Price | Title Company |
|---|---|---|---|
| Mcclintic Lynette R | -- | None Available | |
| Harbin Danny | -- | None Available | |
| Wells Fargo Bank Na | $75,855 | None Available | |
| Brown Thomas J | -- | Chicago Title Ins Co |
Source: Public Records
Mortgage History
| Date | Status | Borrower | Loan Amount |
|---|---|---|---|
| Open | Mcclintic Lynette R | $76,948 | |
| Previous Owner | Brown Thomas J | $67,600 |
Source: Public Records
Tax History Compared to Growth
Tax History
| Year | Tax Paid | Tax Assessment Tax Assessment Total Assessment is a certain percentage of the fair market value that is determined by local assessors to be the total taxable value of land and additions on the property. | Land | Improvement |
|---|---|---|---|---|
| 2025 | $1,566 | $174,700 | $42,000 | $132,700 |
| 2024 | $1,566 | $165,500 | $42,000 | $123,500 |
| 2023 | $1,550 | $158,600 | $42,000 | $116,600 |
| 2022 | $1,512 | $146,800 | $35,000 | $111,800 |
| 2021 | $1,341 | $130,100 | $35,000 | $95,100 |
| 2020 | $853 | $96,500 | $23,500 | $73,000 |
| 2019 | $744 | $89,900 | $17,900 | $72,000 |
| 2018 | $838 | $94,300 | $15,100 | $79,200 |
| 2017 | $822 | $93,100 | $15,100 | $78,000 |
| 2016 | $637 | $84,400 | $15,100 | $69,300 |
| 2014 | $664 | $76,100 | $14,700 | $61,400 |
| 2013 | $664 | $82,400 | $14,700 | $67,700 |
Source: Public Records
Map
Nearby Homes
- 544 Sweetbriar Ave
- 435 Southlane Dr
- 287 Bluestem Ln
- 269 Switchgrass Ln
- 246 Creekway Ct
- 124 Meadow Creek Dr S
- 257 Creekway Ct
- 50 Meadow Creek Blvd
- 847 Willark Dr
- 0 E 700 N Unit MBR22036500
- 172 Country Wood Dr
- 305 Hollybrook Dr
- 240 Shelton Place
- 652 Mooreland Dr
- 49 Meadow Creek Blvd E
- 39 Meadow Creek Blvd E
- 101 Grassyway Ct
- 229 Arlington St
- 380 Parkway St
- 733 Hanover Dr
- 703 Sweetbriar Ave
- 715 Sweetbriar Ave
- 649 Sweetbriar Ave
- 723 Sweetbriar Ave
- 710 Sweetbriar Ave
- 702 Sweetbriar Ave
- 641 Sweetbriar Ave
- 644 Sweetbriar Ave
- 722 Sweetbriar Ave
- Lot C Us 31
- Lot B Us 31
- Lot A Us 31
- Lot D Us 31
- Lot E Us 31
- 635 Sweetbriar Ave
- 451 Pleasant Dr
- 638 Sweetbriar Ave
- 629 Sweetbriar Ave
- 446 Pleasant Dr
- 446 Granada Place