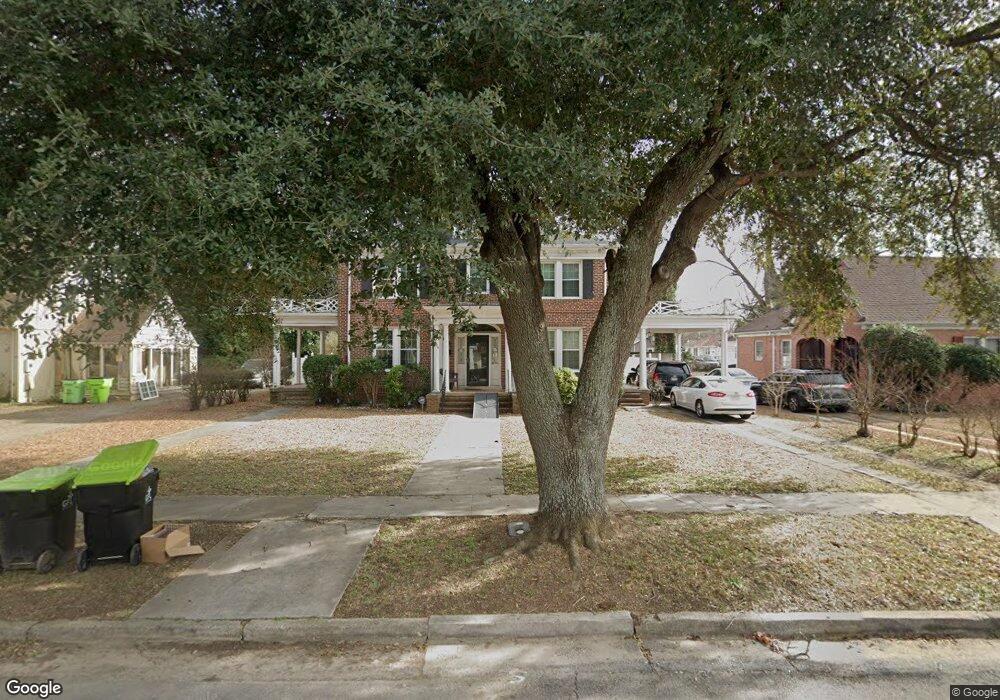
709 Sycamore St Weldon, NC 27890
Estimated Value: $141,000 - $184,000
4
Beds
3
Baths
3,072
Sq Ft
$53/Sq Ft
Est. Value
About This Home
This home is located at 709 Sycamore St, Weldon, NC 27890 and is currently estimated at $163,771, approximately $53 per square foot. 709 Sycamore St is a home located in Halifax County with nearby schools including Weldon Elementary Global Academy, Weldon Middle School, and Roanoke Valley Early College.
Ownership History
Date
Name
Owned For
Owner Type
Purchase Details
Closed on
Jan 24, 2020
Sold by
Carter Ashley C and Covington Cynthia P
Bought by
Covington Terrance T and Covington Sandra
Current Estimated Value
Home Financials for this Owner
Home Financials are based on the most recent Mortgage that was taken out on this home.
Original Mortgage
$98,000
Outstanding Balance
$86,372
Interest Rate
3.8%
Mortgage Type
Adjustable Rate Mortgage/ARM
Estimated Equity
$77,399
Purchase Details
Closed on
Sep 21, 1999
Bought by
Covington Cynthia P and Covington Covington,Ashley S
Create a Home Valuation Report for This Property
The Home Valuation Report is an in-depth analysis detailing your home's value as well as a comparison with similar homes in the area
Purchase History
| Date | Buyer | Sale Price | Title Company |
|---|---|---|---|
| Covington Terrance T | -- | None Available | |
| Covington Cynthia P | -- | -- |
Source: Public Records
Mortgage History
| Date | Status | Borrower | Loan Amount |
|---|---|---|---|
| Open | Covington Terrance T | $98,000 |
Source: Public Records
Tax History
| Year | Tax Paid | Tax Assessment Tax Assessment Total Assessment is a certain percentage of the fair market value that is determined by local assessors to be the total taxable value of land and additions on the property. | Land | Improvement |
|---|---|---|---|---|
| 2025 | $28 | $143,100 | $5,800 | $137,300 |
| 2024 | $28 | $143,100 | $5,800 | $137,300 |
| 2023 | $2,328 | $111,500 | $5,800 | $105,700 |
| 2022 | $2,116 | $111,500 | $5,800 | $105,700 |
| 2021 | $1,155 | $111,500 | $5,800 | $105,700 |
| 2020 | $1,174 | $111,500 | $5,800 | $105,700 |
| 2019 | $1,161 | $110,100 | $5,800 | $104,300 |
| 2018 | $1,138 | $106,100 | $5,800 | $100,300 |
| 2017 | $2,025 | $106,100 | $5,800 | $100,300 |
| 2016 | $1,157 | $106,100 | $5,800 | $100,300 |
| 2015 | $1,090 | $106,100 | $5,800 | $100,300 |
| 2014 | $2,008 | $119,480 | $8,280 | $111,200 |
Source: Public Records
Map
Nearby Homes
- 604 Washington Ave
- 407 Brownell St
- 1406 Elm St
- Tbd County Rd
- 1515 4th Ave
- 1511 4th Ave
- Lot 88R Old Farm Rd
- 0 Summitt Ave (Old Farm Road) Unit 140564
- 1507 4th Ave
- 317 Summitt Ave (Old Farm Rd)
- 319 Summitt Ave (Old Farm Road)
- 1501 4th Ave
- 305 Rollingwood Rd
- 133 Devonshire Cir
- P1202366 N Carolina 125
- 104 Dunshill Rd
- 7 Highway 125
- 10-A Highway 125
- 764 Rivers Edge Pkwy
- 770 Rivers Edge Pkwy
Your Personal Tour Guide
Ask me questions while you tour the home.