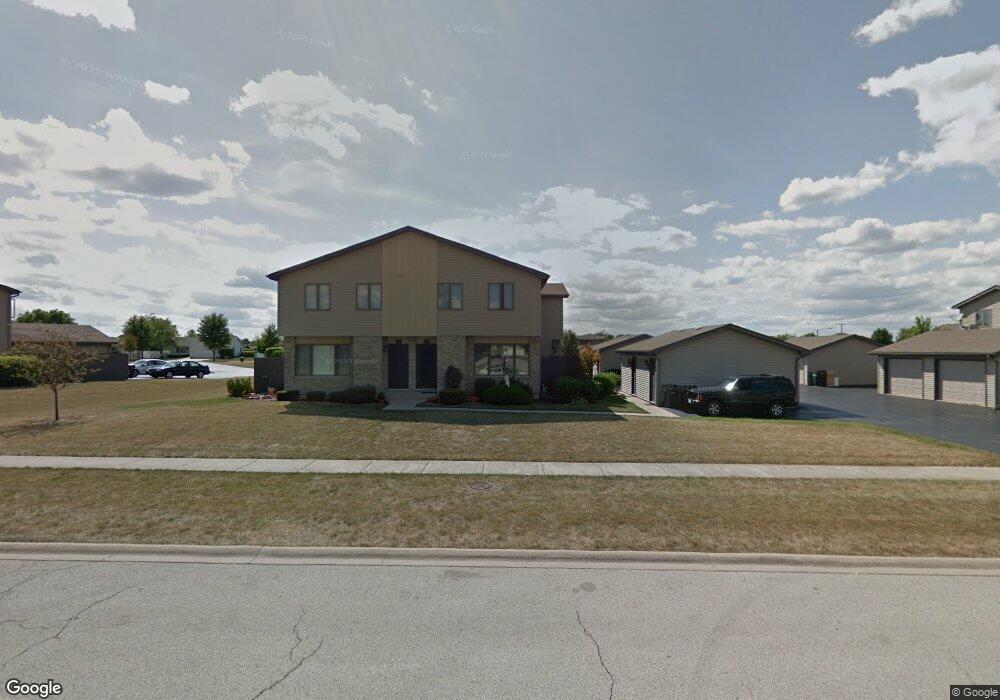
709 Tauber Rd Unit 1 New Lenox, IL 60451
Estimated Value: $230,084 - $259,000
--
Bed
--
Bath
--
Sq Ft
0.41
Acres
About This Home
This home is located at 709 Tauber Rd Unit 1, New Lenox, IL 60451 and is currently estimated at $244,271. 709 Tauber Rd Unit 1 is a home located in Will County with nearby schools including Bentley Elementary School, Arnold J Tyler School, and Alex M Martino Jr High School.
Ownership History
Date
Name
Owned For
Owner Type
Purchase Details
Closed on
Feb 13, 2017
Sold by
Gust Marlene G
Bought by
Gust Marlene and Trust Agreement Of Marlene Gus
Current Estimated Value
Purchase Details
Closed on
Oct 17, 2003
Sold by
Spalla Bonnie J
Bought by
Gust Marlene G
Home Financials for this Owner
Home Financials are based on the most recent Mortgage that was taken out on this home.
Original Mortgage
$102,750
Interest Rate
8.85%
Mortgage Type
Purchase Money Mortgage
Purchase Details
Closed on
Apr 30, 1997
Sold by
Lester William J and Lester Marie E
Bought by
Spalla Bonnie J
Purchase Details
Closed on
Jun 26, 1995
Sold by
Nlsb
Bought by
Lester William J and Prischman Marie E
Home Financials for this Owner
Home Financials are based on the most recent Mortgage that was taken out on this home.
Original Mortgage
$90,900
Interest Rate
7%
Mortgage Type
Construction
Create a Home Valuation Report for This Property
The Home Valuation Report is an in-depth analysis detailing your home's value as well as a comparison with similar homes in the area
Home Values in the Area
Average Home Value in this Area
Purchase History
| Date | Buyer | Sale Price | Title Company |
|---|---|---|---|
| Gust Marlene | -- | None Available | |
| Gust Marlene G | $137,000 | Chicago Title Insurance Co | |
| Spalla Bonnie J | $102,000 | -- | |
| Lester William J | $91,000 | Chicago Title Insurance Co |
Source: Public Records
Mortgage History
| Date | Status | Borrower | Loan Amount |
|---|---|---|---|
| Previous Owner | Gust Marlene G | $102,750 | |
| Previous Owner | Lester William J | $90,900 |
Source: Public Records
Tax History Compared to Growth
Tax History
| Year | Tax Paid | Tax Assessment Tax Assessment Total Assessment is a certain percentage of the fair market value that is determined by local assessors to be the total taxable value of land and additions on the property. | Land | Improvement |
|---|---|---|---|---|
| 2024 | $2,351 | $64,986 | $8,667 | $56,319 |
| 2023 | $2,351 | $59,240 | $7,901 | $51,339 |
| 2022 | $2,940 | $54,574 | $7,279 | $47,295 |
| 2021 | $2,978 | $51,325 | $6,846 | $44,479 |
| 2020 | $3,006 | $49,494 | $6,602 | $42,892 |
| 2019 | $2,975 | $47,959 | $6,397 | $41,562 |
| 2018 | $3,579 | $46,306 | $6,176 | $40,130 |
| 2017 | $3,392 | $44,974 | $5,998 | $38,976 |
| 2016 | $3,285 | $43,770 | $5,837 | $37,933 |
| 2015 | $3,155 | $42,392 | $5,653 | $36,739 |
| 2014 | $3,155 | $41,868 | $5,583 | $36,285 |
| 2013 | $3,155 | $42,432 | $5,658 | $36,774 |
Source: Public Records
Map
Nearby Homes
- 513 Somerset Ln
- 449 Somerset Ln Unit 1
- 709 Garadice Dr
- 920 Barnside Rd
- 203 Tonell Ave
- 1017 E Lincoln Hwy
- 235 Roberts Rd
- 214 Somerset Ct
- 125 N Anderson Rd
- 1535 Glenbrooke Ln
- 808 Stonegate Rd
- 328 E Lincoln Hwy
- 1351 E Lincoln Hwy
- 701 Bishops Gate
- 1212 Georgias Way
- 1139 Georgias Way
- 1193 Georgias Way
- 1125 Georgias Way
- 641 Lisson Grove
- 1245 Georgias Way
- 713 Tauber Rd Unit 3
- 711 Tauber Rd Unit 2
- 715 Tauber Rd Unit 4
- 717 Tauber Rd Unit 1
- 719 Tauber Rd Unit 2
- 705 Tauber Rd Unit 3
- 707 Tauber Rd Unit 4
- 703 Tauber Rd Unit 2
- 701 Tauber Rd Unit 1
- 722 Sojourn Rd Unit 4
- 718 Sojourn Rd Unit 2
- 720 Sojourn Rd Unit 3
- 718 Sojourn Rd
- 716 Sojourn Rd Unit 1
- 716 Sojourn Rd Unit 716
- 723 Tauber Rd Unit 2
- 721 Tauber Rd Unit 1
- 787 Tauber Ct
- 787 Amanda Rd