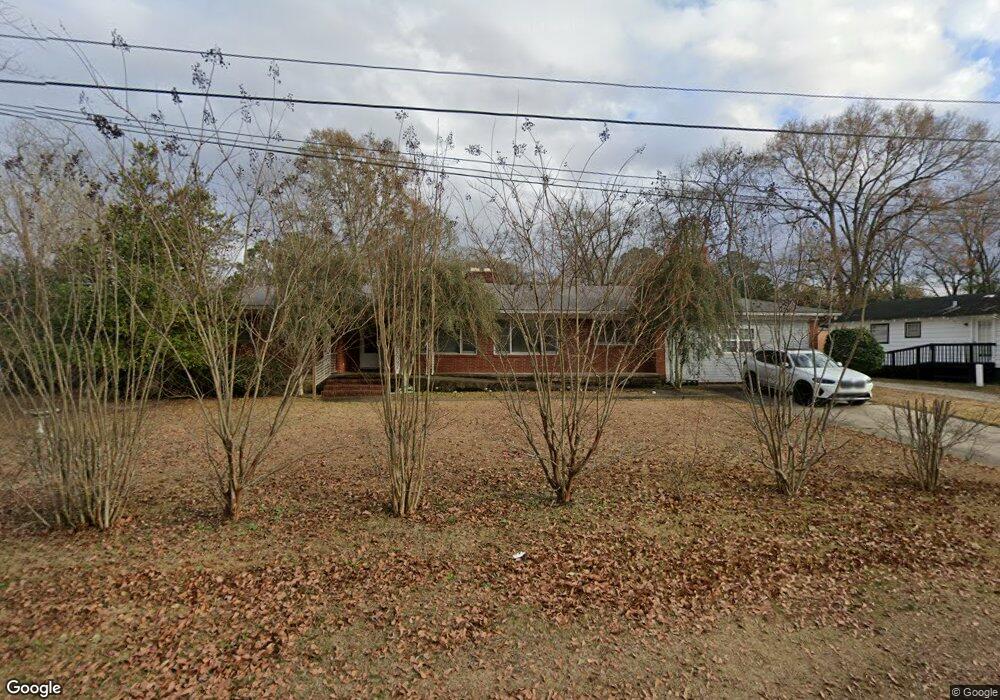
709 Thompson St Vidalia, GA 30474
Estimated Value: $70,000 - $218,000
--
Bed
2
Baths
2,220
Sq Ft
$69/Sq Ft
Est. Value
About This Home
This home is located at 709 Thompson St, Vidalia, GA 30474 and is currently estimated at $152,793, approximately $68 per square foot. 709 Thompson St is a home located in Toombs County with nearby schools including J.D. Dickerson Primary School, Sally Dailey Meadows Elementary School, and J.R. Trippe Middle School.
Ownership History
Date
Name
Owned For
Owner Type
Purchase Details
Closed on
Aug 6, 2012
Sold by
Mccord Elzie
Bought by
Mccord Elzie and Wright Euteria
Current Estimated Value
Purchase Details
Closed on
Aug 10, 2011
Sold by
Montgomery Bank & Trust
Bought by
Mccord Elzie
Home Financials for this Owner
Home Financials are based on the most recent Mortgage that was taken out on this home.
Original Mortgage
$58,400
Interest Rate
4.54%
Mortgage Type
New Conventional
Purchase Details
Closed on
Mar 3, 2011
Sold by
Day Rogers
Bought by
Montgomery Bank & Trust
Purchase Details
Closed on
Nov 8, 2007
Sold by
Caraway Enterprises Llc
Bought by
Day Rogers and Day Betty
Purchase Details
Closed on
Mar 12, 2007
Sold by
Citimortgage Inc
Bought by
Caraway Enterprises Llc
Purchase Details
Closed on
Sep 5, 2006
Sold by
Citimortgage Inc
Bought by
Citimortgage Inc
Create a Home Valuation Report for This Property
The Home Valuation Report is an in-depth analysis detailing your home's value as well as a comparison with similar homes in the area
Home Values in the Area
Average Home Value in this Area
Purchase History
| Date | Buyer | Sale Price | Title Company |
|---|---|---|---|
| Mccord Elzie | -- | -- | |
| Mccord Elzie | $73,000 | -- | |
| Montgomery Bank & Trust | -- | -- | |
| Day Rogers | $80,000 | -- | |
| Caraway Enterprises Llc | $60,000 | -- | |
| Citimortgage Inc | $67,900 | -- |
Source: Public Records
Mortgage History
| Date | Status | Borrower | Loan Amount |
|---|---|---|---|
| Previous Owner | Mccord Elzie | $58,400 |
Source: Public Records
Tax History Compared to Growth
Tax History
| Year | Tax Paid | Tax Assessment Tax Assessment Total Assessment is a certain percentage of the fair market value that is determined by local assessors to be the total taxable value of land and additions on the property. | Land | Improvement |
|---|---|---|---|---|
| 2024 | $1,169 | $42,581 | $1,555 | $41,026 |
| 2023 | $1,131 | $40,311 | $1,555 | $38,756 |
| 2022 | $322 | $35,574 | $1,555 | $34,019 |
| 2021 | $249 | $26,321 | $1,555 | $24,766 |
| 2020 | $235 | $24,350 | $1,555 | $22,795 |
| 2019 | $234 | $24,350 | $1,555 | $22,795 |
| 2018 | $234 | $24,350 | $1,555 | $22,795 |
| 2017 | $246 | $25,248 | $1,728 | $23,520 |
| 2016 | $246 | $25,264 | $1,728 | $23,536 |
| 2015 | -- | $28,210 | $1,728 | $26,482 |
| 2014 | -- | $29,265 | $2,782 | $26,482 |
Source: Public Records
Map
Nearby Homes
- 707 Thompson St
- 713 Thompson St
- 705 Thompson St
- 108 Toombs St W
- 712 Thompson St
- 111 Toombs St W
- 100 Toombs St W
- 205 Toombs St W
- 112 Lang St
- 108 Lang St
- 704 Mcintosh St
- 806 Thompson Street Extension
- 104 Lang St
- 0 Hwy 292 Unit 8314248
- 000 Hwy 292
- 0 Georgia 292
- 000 292 Hwy
- 209 Toombs St W
- 210 Crooms St
- 901 Thompson Street Extension