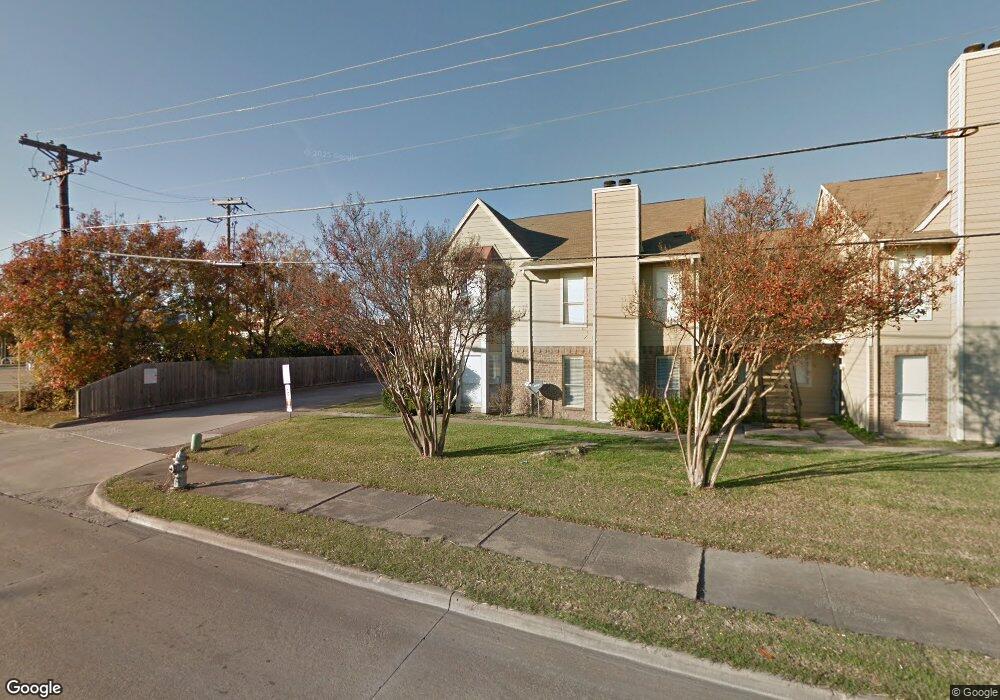
709 W Buckingham Rd Unit 8 Garland, TX 75040
North Garland NeighborhoodEstimated Value: $138,019 - $183,000
2
Beds
2
Baths
926
Sq Ft
$175/Sq Ft
Est. Value
About This Home
This home is located at 709 W Buckingham Rd Unit 8, Garland, TX 75040 and is currently estimated at $162,005, approximately $174 per square foot. 709 W Buckingham Rd Unit 8 is a home located in Dallas County with nearby schools including North Garland Montessori School and Garland Christian Academy.
Ownership History
Date
Name
Owned For
Owner Type
Purchase Details
Closed on
Jul 19, 2011
Sold by
Guo Chengkang
Bought by
Tcn Investments Ii Llc
Current Estimated Value
Home Financials for this Owner
Home Financials are based on the most recent Mortgage that was taken out on this home.
Original Mortgage
$1,700,000
Outstanding Balance
$1,170,653
Interest Rate
4.53%
Mortgage Type
Purchase Money Mortgage
Estimated Equity
-$1,008,648
Purchase Details
Closed on
Nov 23, 2009
Sold by
Xie Zhiyun
Bought by
Guo Chengkang
Home Financials for this Owner
Home Financials are based on the most recent Mortgage that was taken out on this home.
Original Mortgage
$31,000
Interest Rate
4.83%
Mortgage Type
Seller Take Back
Purchase Details
Closed on
Oct 28, 2002
Sold by
Anderson John K and Anderson Esther N
Bought by
Xie Zhiyun
Home Financials for this Owner
Home Financials are based on the most recent Mortgage that was taken out on this home.
Original Mortgage
$32,000
Interest Rate
5.95%
Create a Home Valuation Report for This Property
The Home Valuation Report is an in-depth analysis detailing your home's value as well as a comparison with similar homes in the area
Home Values in the Area
Average Home Value in this Area
Purchase History
| Date | Buyer | Sale Price | Title Company |
|---|---|---|---|
| Tcn Investments Ii Llc | -- | Ctot | |
| Guo Chengkang | -- | None Available | |
| Xie Zhiyun | -- | -- |
Source: Public Records
Mortgage History
| Date | Status | Borrower | Loan Amount |
|---|---|---|---|
| Open | Tcn Investments Ii Llc | $1,700,000 | |
| Previous Owner | Guo Chengkang | $31,000 | |
| Previous Owner | Xie Zhiyun | $32,000 |
Source: Public Records
Tax History Compared to Growth
Tax History
| Year | Tax Paid | Tax Assessment Tax Assessment Total Assessment is a certain percentage of the fair market value that is determined by local assessors to be the total taxable value of land and additions on the property. | Land | Improvement |
|---|---|---|---|---|
| 2025 | $2,443 | $139,830 | $24,060 | $115,770 |
| 2024 | $2,443 | $147,230 | $24,060 | $123,170 |
| 2023 | $2,443 | $89,530 | $16,850 | $72,680 |
| 2022 | $2,201 | $89,530 | $16,850 | $72,680 |
| 2021 | $2,051 | $77,990 | $16,850 | $61,140 |
| 2020 | $2,079 | $77,990 | $16,850 | $61,140 |
| 2019 | $2,612 | $92,600 | $16,850 | $75,750 |
| 2018 | $911 | $32,290 | $7,220 | $25,070 |
| 2017 | $910 | $32,290 | $7,220 | $25,070 |
| 2016 | $910 | $32,290 | $7,220 | $25,070 |
| 2015 | $847 | $32,290 | $7,220 | $25,070 |
| 2014 | $847 | $32,290 | $7,220 | $25,070 |
Source: Public Records
Map
Nearby Homes
- 1913 Northwind Ct
- 730 Woodcastle Dr
- 625 Camilla Ln
- 1906 Glencrest Ln
- 701 Woodcastle Dr
- 1910 Wyster Dr
- 614 Brookfield Dr
- 602 Brookfield Dr
- 2118 Lansdowne Dr
- 821 Daventry Dr
- 1502 Rahall St
- 2026 Lamont Dr
- 2106 Lamont Dr
- 1921 Northwood Dr
- 2105 Crist Rd
- 2201 Ember Lee Dr
- 836 Travis St
- 1310 Kingsbridge Dr
- 1209 Sylvan Dr
- 806 Pebblecreek Dr
- 717 W Buckingham Rd Unit 8
- 717 W Buckingham Rd Unit 7
- 717 W Buckingham Rd Unit 6E
- 717 W Buckingham Rd Unit 5E
- 717 W Buckingham Rd Unit 4
- 717 W Buckingham Rd Unit 3E
- 717 W Buckingham Rd Unit 2E
- 717 W Buckingham Rd Unit 1E
- 701 W Buckingham Rd Unit 8
- 701 W Buckingham Rd Unit 7D
- 701 W Buckingham Rd Unit 6D
- 701 W Buckingham Rd Unit 5D
- 701 W Buckingham Rd Unit 4
- 701 W Buckingham Rd Unit 3D
- 701 W Buckingham Rd Unit 2D
- 701 W Buckingham Rd Unit 1D
- 705 W Buckingham Rd Unit 8
- 705 W Buckingham Rd Unit 7C
- 705 W Buckingham Rd Unit 6C
- 705 W Buckingham Rd Unit 5C