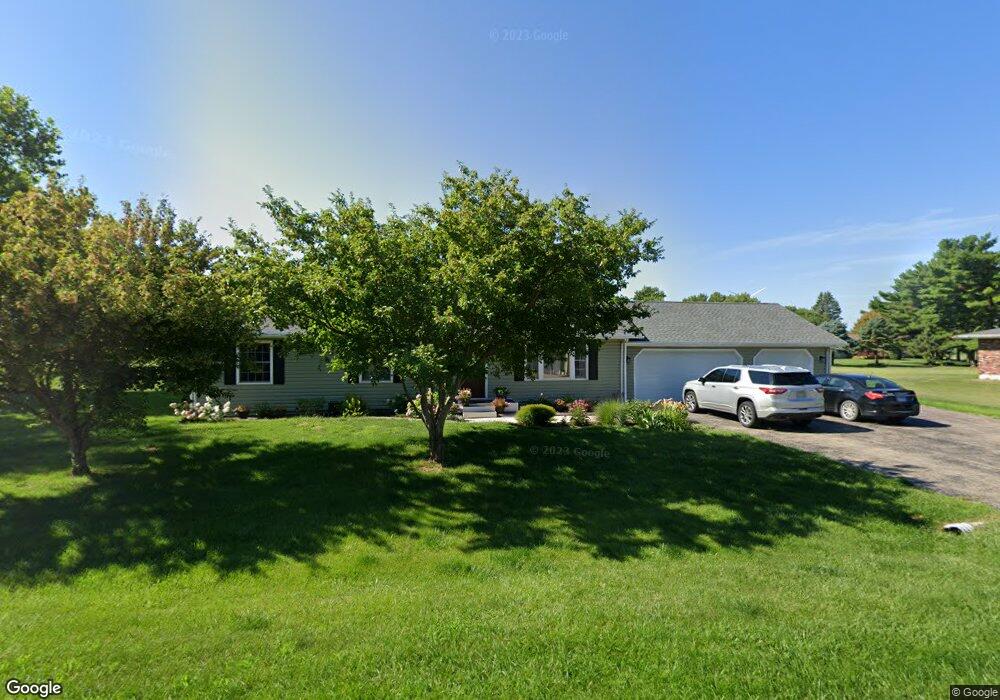
709 W Gardner St Sublette, IL 61367
Estimated Value: $164,000 - $223,000
--
Bed
--
Bath
1,350
Sq Ft
$140/Sq Ft
Est. Value
About This Home
This home is located at 709 W Gardner St, Sublette, IL 61367 and is currently estimated at $188,389, approximately $139 per square foot. 709 W Gardner St is a home located in Lee County with nearby schools including Amboy Central Elementary School, Amboy Junior High School, and Amboy High School.
Ownership History
Date
Name
Owned For
Owner Type
Purchase Details
Closed on
Dec 28, 2016
Sold by
Lee County Sheriff
Bought by
Champaign Investment Llc
Current Estimated Value
Purchase Details
Closed on
Dec 7, 2016
Sold by
Champaign Investment Llc
Bought by
Stephenitch Matthew D
Create a Home Valuation Report for This Property
The Home Valuation Report is an in-depth analysis detailing your home's value as well as a comparison with similar homes in the area
Home Values in the Area
Average Home Value in this Area
Purchase History
| Date | Buyer | Sale Price | Title Company |
|---|---|---|---|
| Champaign Investment Llc | -- | -- | |
| Stephenitch Matthew D | $66,000 | -- |
Source: Public Records
Tax History Compared to Growth
Tax History
| Year | Tax Paid | Tax Assessment Tax Assessment Total Assessment is a certain percentage of the fair market value that is determined by local assessors to be the total taxable value of land and additions on the property. | Land | Improvement |
|---|---|---|---|---|
| 2024 | $3,308 | $54,640 | $5,772 | $48,868 |
| 2023 | $2,545 | $40,710 | $5,497 | $35,213 |
| 2022 | $2,369 | $46,290 | $5,043 | $41,247 |
| 2021 | $2,599 | $48,263 | $4,825 | $43,438 |
| 2020 | $2,559 | $46,857 | $4,684 | $42,173 |
| 2019 | $2,561 | $37,689 | $4,548 | $33,141 |
| 2018 | $2,451 | $35,894 | $4,331 | $31,563 |
| 2017 | $2,339 | $31,667 | $4,331 | $27,336 |
| 2016 | $1,885 | $31,667 | $4,331 | $27,336 |
| 2015 | $1,516 | $31,667 | $4,331 | $27,336 |
| 2014 | $1,511 | $31,667 | $4,331 | $27,336 |
| 2013 | $197 | $38,131 | $3,583 | $34,548 |
Source: Public Records
Map
Nearby Homes
- 10-202 Woodhaven Lakes
- 302 S John St
- 206 S Poplar St
- 1-108 Woodhaven Lakes
- 9-49 Woodhaven Lakes
- 8-89 Woodhaven Lakes
- 24-181 Woodhaven Lakes
- 25-30/31 Woodhaven Lakes
- 21/244 Woodhaven
- 24/65 Woodhaven Lakes
- 26-185 Woodhaven Lakes
- 10-159 Woodhaven Lakes
- 3-118 Woodhaven Lakes
- 24-82 Woodhaven Lakes
- 10-158 Woodhaven Lakes
- 17/83 Woodhaven
- 10 266/267 Woodhaven
- 25-37 Woodhaven
- 21/102 Woodhaven
- 2/24 Woodhaven
- 803 W Gardner St
- 704 W Santee St
- 802 W Santee St
- 302 N Cook St
- 800 W Gardner St
- 704 W Gardner St
- 802 W Gardner St
- 702 W Santee St
- 804 W Santee St
- 700 W Gardner St
- 707 W Santee St
- 801 W Santee St
- 705 W Santee St
- 703 W Santee St
- 803 W Santee St
- 803 W Countrylane St
- 303 N Cook St
- 703 W Country Lane St
- 701 W Santee St
- 403 N Inlet Rd