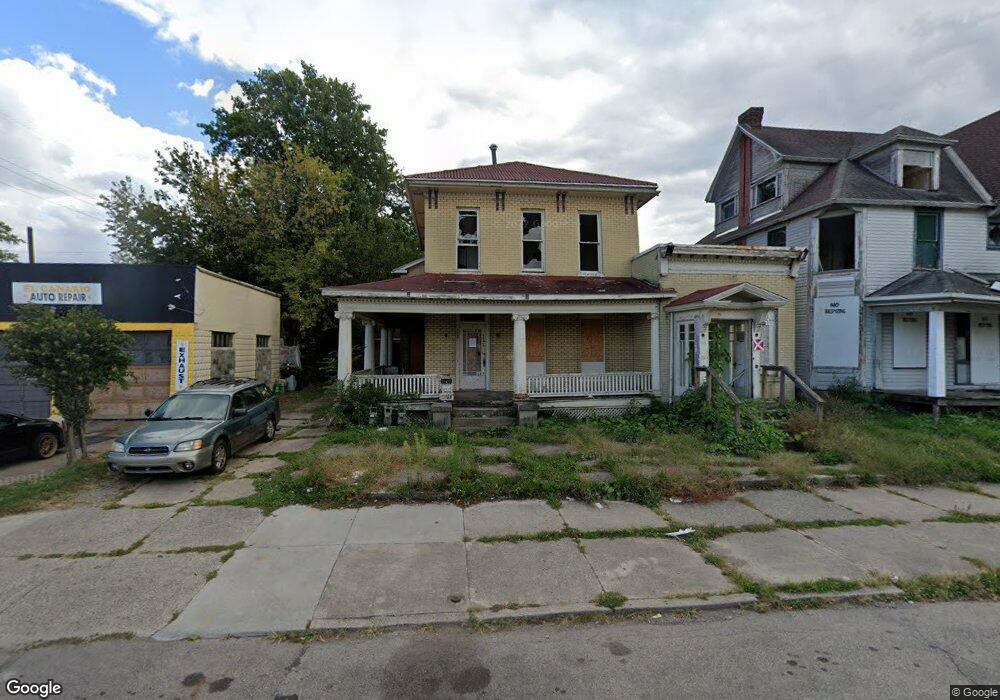
709 W Main St Springfield, OH 45504
Estimated Value: $31,708 - $105,000
6
Beds
3
Baths
3,160
Sq Ft
$22/Sq Ft
Est. Value
About This Home
This home is located at 709 W Main St, Springfield, OH 45504 and is currently estimated at $68,927, approximately $21 per square foot. 709 W Main St is a home located in Clark County with nearby schools including Snyder Park Elementary School, Roosevelt Middle School, and Springfield High School.
Ownership History
Date
Name
Owned For
Owner Type
Purchase Details
Closed on
Apr 10, 2019
Sold by
Rude Jerry L
Bought by
Holmes Alexander Austin
Current Estimated Value
Purchase Details
Closed on
Jan 23, 2013
Sold by
Mundy James G
Bought by
Rude Jerry L
Purchase Details
Closed on
Dec 1, 2011
Sold by
Mundy Michelle and Mundy Michelle R
Bought by
Mundy James G
Purchase Details
Closed on
Nov 1, 2003
Sold by
Mccarty Gregory and Mccarty Karen
Bought by
Rude Jerry
Purchase Details
Closed on
Jul 18, 2001
Sold by
Banc One Financial Services Inc
Bought by
Edley Gary L
Purchase Details
Closed on
Mar 29, 1999
Sold by
Mccarty James F and Mccarty Loraine
Bought by
Frye Waite
Home Financials for this Owner
Home Financials are based on the most recent Mortgage that was taken out on this home.
Original Mortgage
$60,000
Interest Rate
6.94%
Mortgage Type
Purchase Money Mortgage
Purchase Details
Closed on
Jan 26, 1996
Sold by
Mccarty James F
Bought by
Frye Waite H
Create a Home Valuation Report for This Property
The Home Valuation Report is an in-depth analysis detailing your home's value as well as a comparison with similar homes in the area
Home Values in the Area
Average Home Value in this Area
Purchase History
| Date | Buyer | Sale Price | Title Company |
|---|---|---|---|
| Holmes Alexander Austin | $17,500 | Team Ttl & Closing Svcs Llc | |
| Rude Jerry L | $7,000 | None Available | |
| Mundy James G | -- | Attorney | |
| Rude Jerry | $32,500 | -- | |
| Edley Gary L | $11,000 | -- | |
| Frye Waite | $33,000 | Tower City Title Agency Inc | |
| Frye Waite H | $33,000 | -- |
Source: Public Records
Mortgage History
| Date | Status | Borrower | Loan Amount |
|---|---|---|---|
| Previous Owner | Frye Waite | $60,000 | |
| Closed | Frye Waite H | $0 |
Source: Public Records
Tax History
| Year | Tax Paid | Tax Assessment Tax Assessment Total Assessment is a certain percentage of the fair market value that is determined by local assessors to be the total taxable value of land and additions on the property. | Land | Improvement |
|---|---|---|---|---|
| 2025 | $20,575 | $1,460 | $1,460 | -- |
| 2024 | $19,648 | $1,190 | $1,190 | -- |
| 2023 | $11,541 | $5,590 | $1,190 | $4,400 |
| 2022 | $6,453 | $19,980 | $2,370 | $17,610 |
| 2021 | $887 | $16,140 | $2,080 | $14,060 |
| 2020 | $889 | $16,140 | $2,080 | $14,060 |
| 2019 | $891 | $16,140 | $2,080 | $14,060 |
| 2018 | $679 | $11,800 | $2,080 | $9,720 |
| 2017 | $678 | $11,799 | $2,079 | $9,720 |
| 2016 | $679 | $11,799 | $2,079 | $9,720 |
| 2015 | $693 | $11,799 | $2,079 | $9,720 |
| 2014 | $690 | $11,799 | $2,079 | $9,720 |
| 2013 | $682 | $11,799 | $2,079 | $9,720 |
Source: Public Records
Map
Nearby Homes
- 727 W High St
- 820 W North St
- 217-219 N Race St
- 101`103 N Western
- 222 N Race St Unit 224
- 239 N Shaffer St
- 709-711 W Mulberry St
- 1205 W High St
- 423 N Jackson St Unit 425
- 1225 W High St
- 525 S Light St
- 1124 W Mulberry St
- 412 Dakota Ave
- 1230 W Pleasant St
- 366 N Isabella St
- 207 N Bechtle Ave Unit 209
- 306 N Bechtle Ave
- 1362 W Mulberry St Unit 1364
- 38 W High St Unit 3B
- 1374 W Mulberry St
- 715 W Main St
- 721 W Main St
- 17 S Light St Unit 23
- 17 S Light St Unit 23
- 725 W Main St
- 716 Court St
- 729 W Main St
- 726 Court St
- 0 S Pitchin Rd Unit 759071
- 0 Lower Valley Pike Unit 224043211
- 0 Lower Valley Pike Unit 925322
- 0 Lower Valley Pike Unit 877120
- 0 S Pitchin Rd Unit 218017534
- 0 S Pitchin Rd Unit 856486
- 0 S Pitchin Rd Unit 1015868
- 0 S Pitchin Rd Unit 222001999
- 0 S Pitchin Rd Unit 856434
- 0 Spring Falls Ave Unit 846232
- 0 Windy Ridge Unit 320081
- 0 Lower Valley Pike Unit 1006368
Your Personal Tour Guide
Ask me questions while you tour the home.