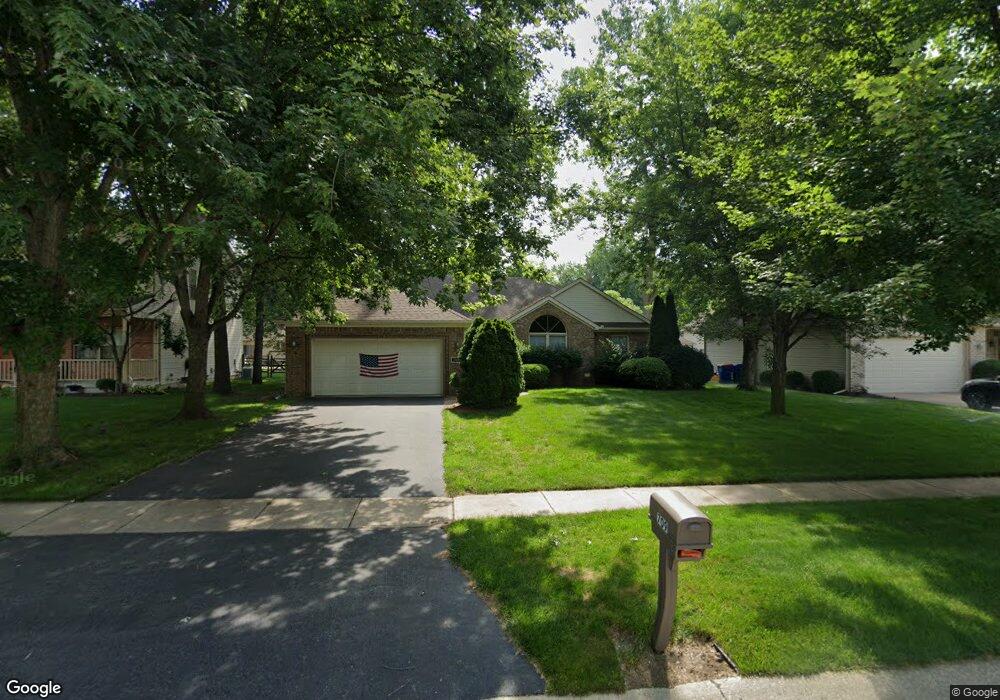
709 Whisperlake Rd Holland, OH 43528
Estimated Value: $309,989 - $385,000
3
Beds
3
Baths
1,759
Sq Ft
$198/Sq Ft
Est. Value
About This Home
This home is located at 709 Whisperlake Rd, Holland, OH 43528 and is currently estimated at $348,747, approximately $198 per square foot. 709 Whisperlake Rd is a home located in Lucas County with nearby schools including Holland Elementary School, Springfield Middle School, and Springfield High School.
Ownership History
Date
Name
Owned For
Owner Type
Purchase Details
Closed on
Oct 16, 2018
Sold by
Donnell Michael W O and Duffer Blackford Barbara Ann
Bought by
Donnell Michael W O
Current Estimated Value
Purchase Details
Closed on
Mar 16, 2007
Sold by
Likes Rickland L and Deturk Shauna L
Bought by
Blackford Richard C and Duffer Blackford Barbara A
Home Financials for this Owner
Home Financials are based on the most recent Mortgage that was taken out on this home.
Original Mortgage
$135,900
Outstanding Balance
$82,887
Interest Rate
6.4%
Mortgage Type
Purchase Money Mortgage
Estimated Equity
$265,860
Purchase Details
Closed on
Apr 24, 2003
Sold by
Louisville Title Agency For Nw Ohio Inc
Bought by
Likes Rickland L and Deturk Shauna L
Home Financials for this Owner
Home Financials are based on the most recent Mortgage that was taken out on this home.
Original Mortgage
$193,500
Interest Rate
4.5%
Mortgage Type
Purchase Money Mortgage
Create a Home Valuation Report for This Property
The Home Valuation Report is an in-depth analysis detailing your home's value as well as a comparison with similar homes in the area
Home Values in the Area
Average Home Value in this Area
Purchase History
| Date | Buyer | Sale Price | Title Company |
|---|---|---|---|
| Donnell Michael W O | -- | None Available | |
| Blackford Richard C | $225,900 | Attorney | |
| Likes Rickland L | $215,000 | Louisville Title Agency For |
Source: Public Records
Mortgage History
| Date | Status | Borrower | Loan Amount |
|---|---|---|---|
| Open | Blackford Richard C | $135,900 | |
| Closed | Likes Rickland L | $193,500 |
Source: Public Records
Tax History Compared to Growth
Tax History
| Year | Tax Paid | Tax Assessment Tax Assessment Total Assessment is a certain percentage of the fair market value that is determined by local assessors to be the total taxable value of land and additions on the property. | Land | Improvement |
|---|---|---|---|---|
| 2024 | $1,759 | $81,585 | $18,095 | $63,490 |
| 2023 | $4,443 | $86,415 | $18,445 | $67,970 |
| 2022 | $4,473 | $86,415 | $18,445 | $67,970 |
| 2021 | $4,477 | $86,415 | $18,445 | $67,970 |
| 2020 | $4,084 | $72,485 | $15,400 | $57,085 |
| 2019 | $3,977 | $72,485 | $15,400 | $57,085 |
| 2018 | $4,114 | $72,485 | $15,400 | $57,085 |
| 2017 | $4,282 | $73,010 | $15,505 | $57,505 |
| 2016 | $4,327 | $208,600 | $44,300 | $164,300 |
| 2015 | $4,317 | $208,600 | $44,300 | $164,300 |
| 2014 | $3,885 | $70,880 | $15,050 | $55,830 |
| 2013 | $3,885 | $70,880 | $15,050 | $55,830 |
Source: Public Records
Map
Nearby Homes
- 7331 Witherby Ct
- 820 Weatherstone Rd
- 7256 Apache Trail
- 7139 Springfield Dr
- 1054 Clark St
- 1051 Wentworth St
- 508 Crystal Lake Dr
- 134 Deerfield Dr
- 217 Pebble Beach Dr
- 427 S Mccord Rd
- 7238 Lilac Ct
- 343 S Mccord Rd
- 7717 Angola Rd Unit 151
- 1421 Maumee St
- 642 Diana Dr
- 324 Harefoote St
- 7920 N Shoreline Dr
- 352 Cheswick St
- 7709 Fountain Dr
- 426 Cheswick Rd
- 701 Whisperlake Rd
- 717 Whisperlake Rd
- 708 Whisperwood Pkwy
- 683 Whisperlake Rd
- 700 Whisperwood Pkwy
- 716 Whisperwood Pkwy
- 729 Whisperlake Rd
- 712 Whisperlake Rd
- 658 Whisperwood Pkwy
- 702 Whisperlake Rd
- 724 Whisperwood Pkwy
- 720 Whisperlake Rd
- 675 Whisperlake Rd
- 682 Whisperlake Rd
- 650 Whisperwood Pkwy
- 747 Whisperlake Rd
- 728 Whisperlake Rd
- 667 Whisperlake Rd
- 672 Whisperlake Rd
- 711 Whisperwood Pkwy