Estimated Value: $109,000 - $143,000
3
Beds
2
Baths
910
Sq Ft
$140/Sq Ft
Est. Value
About This Home
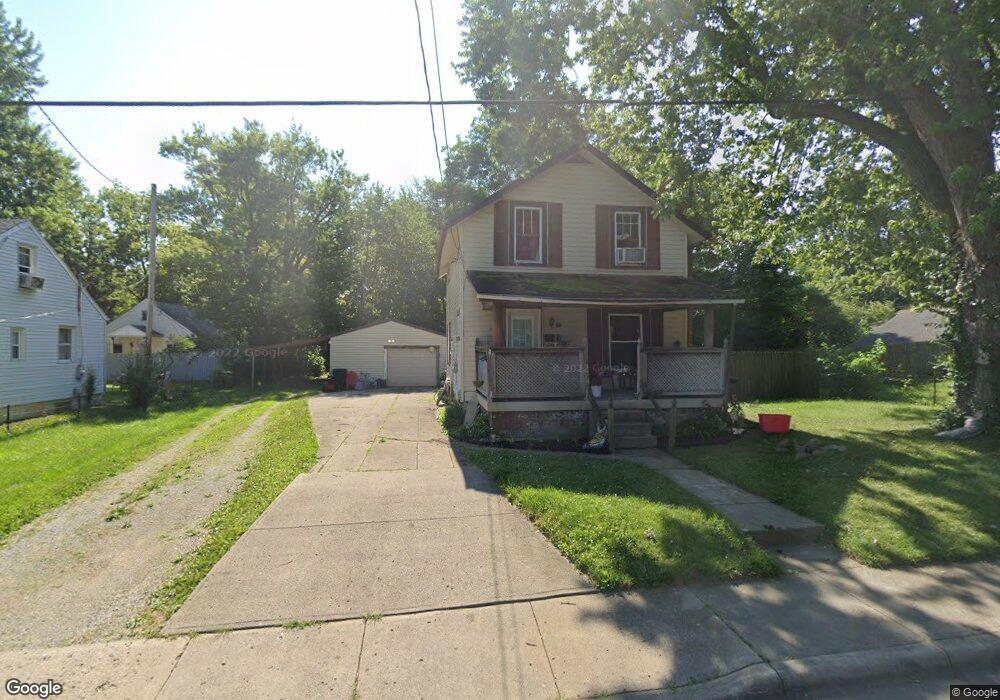
This home is located at 709 Xenia Ave, Xenia, OH 45385 and is currently estimated at $127,254, approximately $139 per square foot. 709 Xenia Ave is a home located in Greene County with nearby schools including Xenia High School, Summit Academy Community School for Alternative Learners - Xenia, and Legacy Christian Academy.
Ownership History
Date
Name
Owned For
Owner Type
Purchase Details
Closed on
Jan 14, 2008
Sold by
Homesales Inc
Bought by
Miller Jessee R
Current Estimated Value
Purchase Details
Closed on
Dec 18, 1995
Sold by
Campbell Henry
Bought by
Johnson Russell H and Johnson K
Home Financials for this Owner
Home Financials are based on the most recent Mortgage that was taken out on this home.
Original Mortgage
$65,400
Interest Rate
7.45%
Mortgage Type
New Conventional
Create a Home Valuation Report for This Property
The Home Valuation Report is an in-depth analysis detailing your home's value as well as a comparison with similar homes in the area
Home Values in the Area
Average Home Value in this Area
Purchase History
| Date | Buyer | Sale Price | Title Company |
|---|---|---|---|
| Miller Jessee R | $31,500 | Accutitle Agency Inc | |
| Johnson Russell H | $68,900 | -- |
Source: Public Records
Mortgage History
| Date | Status | Borrower | Loan Amount |
|---|---|---|---|
| Previous Owner | Johnson Russell H | $65,400 |
Source: Public Records
Tax History Compared to Growth
Tax History
| Year | Tax Paid | Tax Assessment Tax Assessment Total Assessment is a certain percentage of the fair market value that is determined by local assessors to be the total taxable value of land and additions on the property. | Land | Improvement |
|---|---|---|---|---|
| 2024 | $1,231 | $27,400 | $4,600 | $22,800 |
| 2023 | $1,172 | $27,400 | $4,600 | $22,800 |
| 2022 | $1,047 | $20,870 | $3,680 | $17,190 |
| 2021 | $1,061 | $20,870 | $3,680 | $17,190 |
| 2020 | $1,017 | $20,870 | $3,680 | $17,190 |
| 2019 | $965 | $18,640 | $3,660 | $14,980 |
| 2018 | $968 | $18,640 | $3,660 | $14,980 |
| 2017 | $8,392 | $18,640 | $3,660 | $14,980 |
| 2016 | $930 | $17,560 | $3,660 | $13,900 |
| 2015 | $9,128 | $17,560 | $3,660 | $13,900 |
| 2014 | $6,944 | $17,560 | $3,660 | $13,900 |
Source: Public Records
Map
Nearby Homes