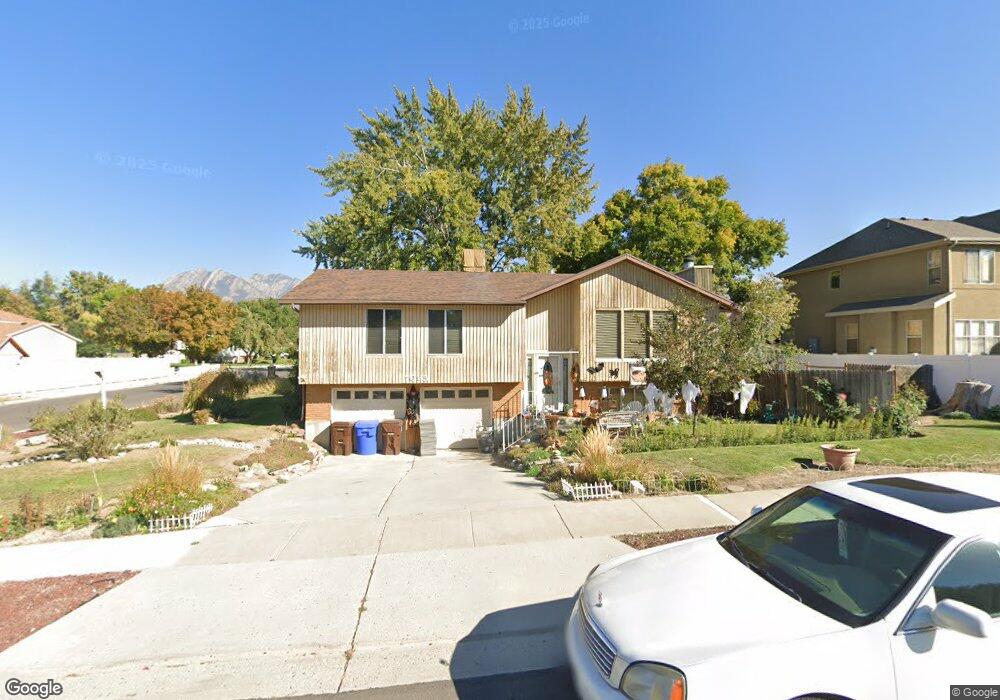
7095 Boggess Dr Midvale, UT 84047
Estimated Value: $526,000 - $628,000
4
Beds
3
Baths
1,276
Sq Ft
$438/Sq Ft
Est. Value
About This Home
This home is located at 7095 Boggess Dr, Midvale, UT 84047 and is currently estimated at $558,517, approximately $437 per square foot. 7095 Boggess Dr is a home located in Salt Lake County with nearby schools including East Midvale Elementary School, Hillcrest High School, and Midvale Middle School.
Ownership History
Date
Name
Owned For
Owner Type
Purchase Details
Closed on
Jan 10, 2008
Sold by
Hicks Joyce E
Bought by
Hicks Joyce E and Hicks Max J
Current Estimated Value
Home Financials for this Owner
Home Financials are based on the most recent Mortgage that was taken out on this home.
Original Mortgage
$348,000
Outstanding Balance
$196,066
Interest Rate
4.18%
Mortgage Type
Reverse Mortgage Home Equity Conversion Mortgage
Estimated Equity
$362,451
Purchase Details
Closed on
Feb 27, 2006
Sold by
Hicks Max J
Bought by
Hicks Joyce E
Purchase Details
Closed on
Jul 21, 2005
Sold by
Kaiser Timothy J
Bought by
Hicks Max J and Hicks Joyce E
Home Financials for this Owner
Home Financials are based on the most recent Mortgage that was taken out on this home.
Original Mortgage
$115,100
Interest Rate
5.48%
Mortgage Type
Fannie Mae Freddie Mac
Create a Home Valuation Report for This Property
The Home Valuation Report is an in-depth analysis detailing your home's value as well as a comparison with similar homes in the area
Home Values in the Area
Average Home Value in this Area
Purchase History
| Date | Buyer | Sale Price | Title Company |
|---|---|---|---|
| Hicks Joyce E | -- | Cottonwood Title | |
| Hicks Joyce E | -- | None Available | |
| Hicks Max J | -- | Sutherland Title |
Source: Public Records
Mortgage History
| Date | Status | Borrower | Loan Amount |
|---|---|---|---|
| Open | Hicks Joyce E | $348,000 | |
| Previous Owner | Hicks Max J | $115,100 |
Source: Public Records
Tax History
| Year | Tax Paid | Tax Assessment Tax Assessment Total Assessment is a certain percentage of the fair market value that is determined by local assessors to be the total taxable value of land and additions on the property. | Land | Improvement |
|---|---|---|---|---|
| 2025 | $86 | $470,800 | $171,300 | $299,500 |
| 2024 | $86 | $451,100 | $161,600 | $289,500 |
| 2023 | $672 | $412,300 | $153,700 | $258,600 |
| 2022 | $672 | $423,500 | $128,100 | $295,400 |
| 2021 | $524 | $320,300 | $118,200 | $202,100 |
| 2020 | $476 | $288,100 | $97,100 | $191,000 |
| 2019 | $448 | $266,100 | $91,600 | $174,500 |
| 2016 | $388 | $220,300 | $91,600 | $128,700 |
Source: Public Records
Map
Nearby Homes
- 7187 S 420 E
- 7045 S 300 E
- 7218 S Viansa Ct
- 529 E 7215 S Unit 9
- 7240 S 525 E Unit A
- 7240 S 525 E Unit B
- 7230 S 525 E Unit A
- 7230 S 525 E Unit B
- 7230 S 525 E
- 7097 S 230 E
- 221 E Fort Union Blvd
- 7309 S Union Village Cir
- 195 E 7060 S
- 6874 S 595 E Unit 66
- 7083 Village Place
- 6969 S Free Land Ave
- 7214 S 160 E Unit 1
- 7222 S 160 E Unit 3
- 512 E Larchwood Dr
- 7432 Green Berry Ct
- 7095 S Boggess Dr
- 7122 S 420 E
- 7094 Boggess Dr
- 416 E Pepperidge Dr
- 416 Pepperidge Dr
- 7126 S 420 E
- 7075 Pepperidge Place
- 397 Villa Place Ct
- 397 E Villa Place Ct
- 397 E Villa Place Ct Unit 8
- 7132 S 420 E Unit 14
- 7100 S 420 E
- 7017 S 420 E
- 393 Villa Place Ct
- 393 Villa Place Ct Unit 9
- 393 E Villa Place Ct
- 387 Villa Place Ct
- 387 E Villa Place Ct
- 7125 S 420 E Unit 17
- 7074 Pepperidge Cir
Your Personal Tour Guide
Ask me questions while you tour the home.