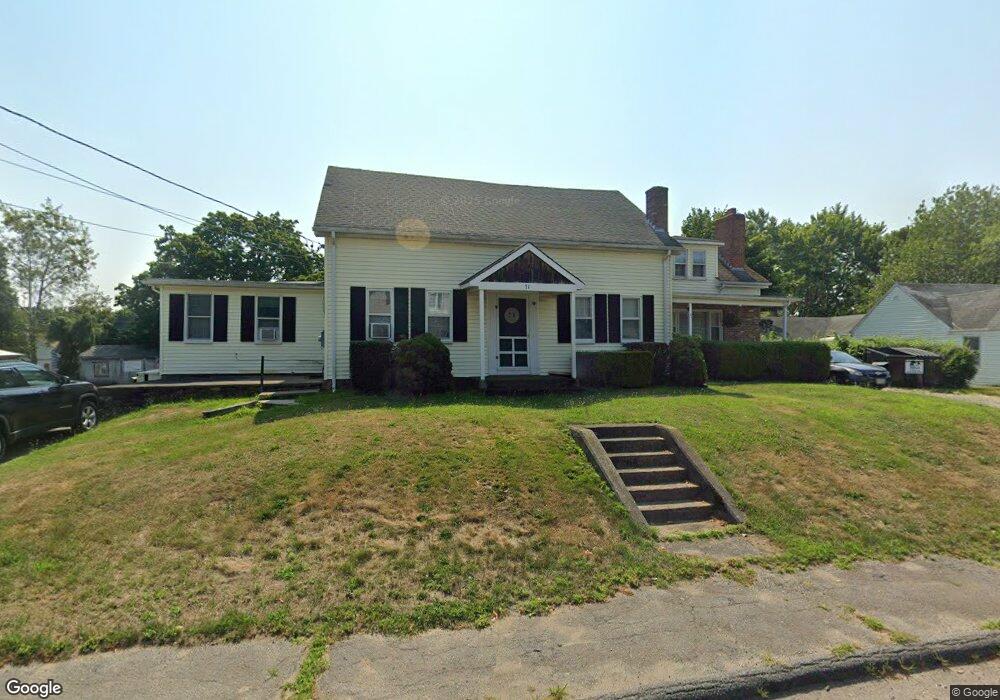
71 Anthony St Seekonk, MA 02771
Monroes-South Seekonk NeighborhoodEstimated Value: $569,108 - $588,000
4
Beds
3
Baths
2,184
Sq Ft
$265/Sq Ft
Est. Value
About This Home
This home is located at 71 Anthony St, Seekonk, MA 02771 and is currently estimated at $578,036, approximately $264 per square foot. 71 Anthony St is a home located in Bristol County with nearby schools including Seekonk High School, St Mary Academy-Bay View, and Providence Country Day School.
Ownership History
Date
Name
Owned For
Owner Type
Purchase Details
Closed on
Oct 27, 1999
Sold by
Watson Ernest N and Watson Barbara A
Bought by
Roy Craig R and Roy Paula J
Current Estimated Value
Home Financials for this Owner
Home Financials are based on the most recent Mortgage that was taken out on this home.
Original Mortgage
$107,976
Interest Rate
7.78%
Mortgage Type
Purchase Money Mortgage
Create a Home Valuation Report for This Property
The Home Valuation Report is an in-depth analysis detailing your home's value as well as a comparison with similar homes in the area
Home Values in the Area
Average Home Value in this Area
Purchase History
| Date | Buyer | Sale Price | Title Company |
|---|---|---|---|
| Roy Craig R | $120,000 | -- |
Source: Public Records
Mortgage History
| Date | Status | Borrower | Loan Amount |
|---|---|---|---|
| Open | Roy Craig R | $186,000 | |
| Closed | Roy Craig R | $121,000 | |
| Closed | Roy Craig R | $107,976 | |
| Previous Owner | Roy Craig R | $50,000 |
Source: Public Records
Tax History
| Year | Tax Paid | Tax Assessment Tax Assessment Total Assessment is a certain percentage of the fair market value that is determined by local assessors to be the total taxable value of land and additions on the property. | Land | Improvement |
|---|---|---|---|---|
| 2025 | $5,183 | $419,700 | $153,600 | $266,100 |
| 2024 | $5,001 | $404,900 | $153,600 | $251,300 |
| 2023 | $4,705 | $358,900 | $130,500 | $228,400 |
| 2022 | $4,271 | $320,200 | $125,300 | $194,900 |
| 2021 | $4,085 | $301,000 | $109,600 | $191,400 |
| 2020 | $4,083 | $310,000 | $110,200 | $199,800 |
| 2019 | $3,887 | $297,600 | $105,100 | $192,500 |
| 2018 | $3,751 | $281,000 | $102,200 | $178,800 |
| 2017 | $3,627 | $269,500 | $99,600 | $169,900 |
| 2016 | $3,593 | $267,900 | $99,600 | $168,300 |
| 2015 | $3,482 | $263,200 | $99,600 | $163,600 |
Source: Public Records
Map
Nearby Homes
- 11 Hawthorne Dr
- 57 Mohawk Dr
- 0 N Wheaton Ave
- 454 Fall River Ave
- 155 Sagamore Rd
- 7 Jill Ct
- 8 Agawam Ct
- 30 Fuller St
- 85 Hospital Rd
- 100 Bradley St
- 34 Palmer River Rd
- 195 Barney Ave
- 0 Pinetop Rd
- 3 Pine Top Rd
- 6 Hazelton Rd
- 0 Wheaton Ave
- 1741 Wampanoag Trail
- 15 George w Finnerty Rd
- 203 Providence St Bldr Lot 5
- 205 Providence St Bldr Lot 3
Your Personal Tour Guide
Ask me questions while you tour the home.