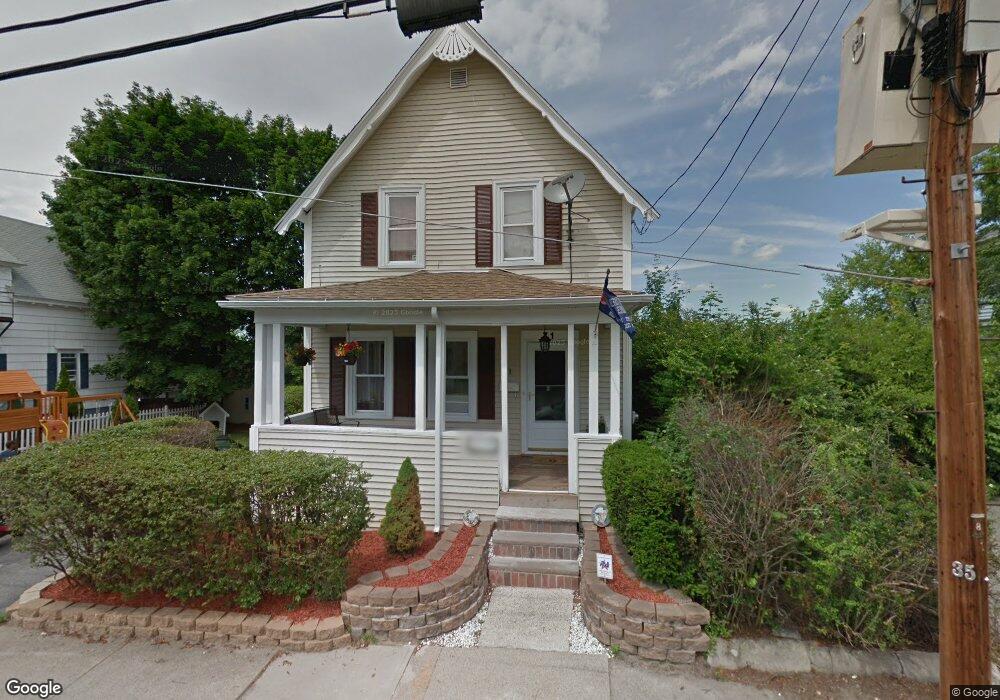
71 Boston St Methuen, MA 01844
The East End NeighborhoodEstimated Value: $499,000 - $528,000
3
Beds
1
Bath
1,200
Sq Ft
$432/Sq Ft
Est. Value
About This Home
This home is located at 71 Boston St, Methuen, MA 01844 and is currently estimated at $518,969, approximately $432 per square foot. 71 Boston St is a home located in Essex County with nearby schools including Timony Grammar School, Methuen High School, and Community Day Charter Public School - Gateway.
Ownership History
Date
Name
Owned For
Owner Type
Purchase Details
Closed on
Mar 2, 2010
Sold by
Owens Jennifer R and Owens Richard C
Bought by
Silvestre Mallen
Current Estimated Value
Home Financials for this Owner
Home Financials are based on the most recent Mortgage that was taken out on this home.
Original Mortgage
$211,105
Outstanding Balance
$140,697
Interest Rate
5.25%
Mortgage Type
FHA
Estimated Equity
$378,272
Purchase Details
Closed on
Jan 8, 2009
Sold by
Hardy James B and Hardy Diana L
Bought by
Owens Jennifer R and Owens Richard C
Home Financials for this Owner
Home Financials are based on the most recent Mortgage that was taken out on this home.
Original Mortgage
$185,000
Interest Rate
5.99%
Mortgage Type
Purchase Money Mortgage
Purchase Details
Closed on
Nov 4, 1992
Sold by
Raytheon Emp Fcu
Bought by
Hardy James B
Create a Home Valuation Report for This Property
The Home Valuation Report is an in-depth analysis detailing your home's value as well as a comparison with similar homes in the area
Home Values in the Area
Average Home Value in this Area
Purchase History
| Date | Buyer | Sale Price | Title Company |
|---|---|---|---|
| Silvestre Mallen | $215,000 | -- | |
| Silvestre Mallen | $215,000 | -- | |
| Owens Jennifer R | $195,000 | -- | |
| Owens Jennifer R | $195,000 | -- | |
| Hardy James B | $90,000 | -- | |
| Hardy James B | $90,000 | -- |
Source: Public Records
Mortgage History
| Date | Status | Borrower | Loan Amount |
|---|---|---|---|
| Open | Silvestre Mallen | $211,105 | |
| Closed | Hardy James B | $211,105 | |
| Previous Owner | Owens Jennifer R | $185,000 |
Source: Public Records
Tax History Compared to Growth
Tax History
| Year | Tax Paid | Tax Assessment Tax Assessment Total Assessment is a certain percentage of the fair market value that is determined by local assessors to be the total taxable value of land and additions on the property. | Land | Improvement |
|---|---|---|---|---|
| 2025 | $4,780 | $451,800 | $207,900 | $243,900 |
| 2024 | $4,637 | $427,000 | $189,000 | $238,000 |
| 2023 | $4,473 | $382,300 | $168,800 | $213,500 |
| 2022 | $4,147 | $317,800 | $135,000 | $182,800 |
| 2021 | $3,908 | $296,300 | $128,300 | $168,000 |
| 2020 | $3,883 | $288,900 | $128,300 | $160,600 |
| 2019 | $3,782 | $266,500 | $121,500 | $145,000 |
| 2018 | $3,603 | $252,500 | $114,800 | $137,700 |
| 2017 | $3,419 | $233,400 | $108,000 | $125,400 |
| 2016 | $3,322 | $224,300 | $101,300 | $123,000 |
| 2015 | $3,203 | $219,400 | $101,300 | $118,100 |
Source: Public Records
Map
Nearby Homes
- 24 Boylston St
- 24 Court St
- 15 Swan Ave
- 9 Boylston St
- 35 Swan Ave
- 35 Kendall St
- 20 Knox St Unit 43
- 20 Knox St Unit 23
- 167 Ferry 53 Mann St Unit 2,5,6
- 68 Wesley St
- 63 Lippold St
- 106 Leroy Ave
- 6 Longwood Dr
- 29 Meadowbrook Rd
- 4 Alderbrook Ln
- 5 Harmony Ln
- 262 E Haverhill St Unit 4
- 7 Magnolia Rd
- 169 Berkeley St
- 65 Brook St
- 77 Boston St
- 65 Boston St
- 21 Vermont St
- 63 Boston St
- 60 Boston St
- 54 Boston St
- 61 Boston St
- 17 Vermont St Unit 19
- 66 Boston St Unit 68
- 81 Boston St Unit 83
- 24-28 Vermont St
- 24 Vermont St Unit 28
- 18 Boylston St
- 57 Boston St Unit 59
- 27 Boylston St
- 5 King St
- 33 Boylston St Unit 2
- 31 Boylston St Unit 33
- 52 Boston St
- 23 Boylston St