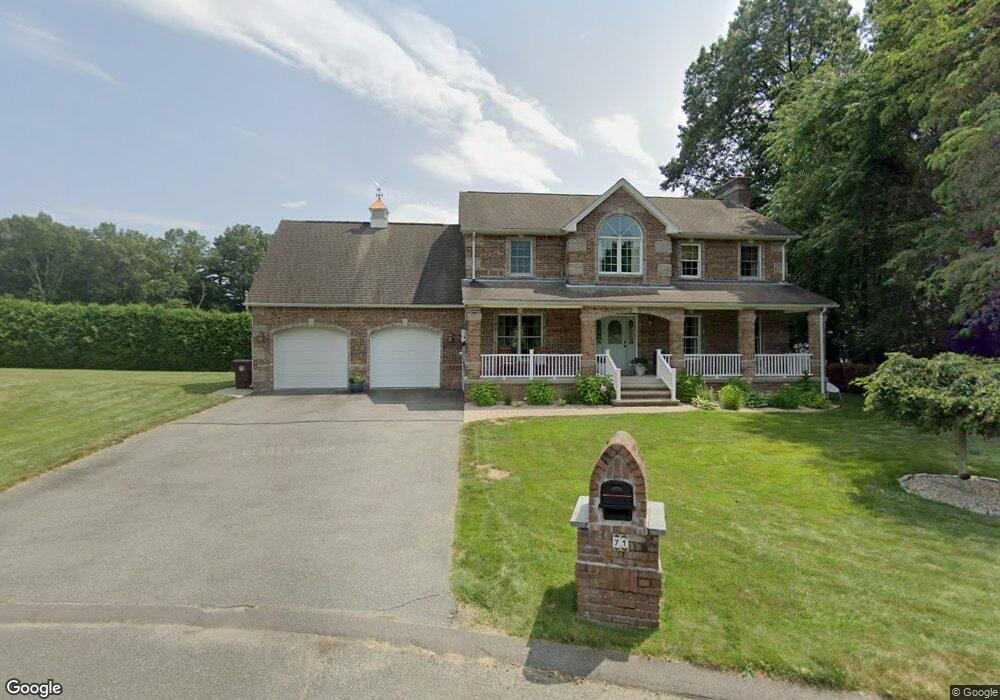
71 Bowles Ave Ludlow, MA 01056
Estimated Value: $473,000 - $582,000
3
Beds
3
Baths
2,350
Sq Ft
$225/Sq Ft
Est. Value
About This Home
This home is located at 71 Bowles Ave, Ludlow, MA 01056 and is currently estimated at $528,850, approximately $225 per square foot. 71 Bowles Ave is a home located in Hampden County with nearby schools including East Street Elementary School, Chapin Street Elementary School, and Paul R. Baird Middle School.
Ownership History
Date
Name
Owned For
Owner Type
Purchase Details
Closed on
Mar 25, 2021
Sold by
Mateus George M
Bought by
Mateus George M and Mole Maria
Current Estimated Value
Purchase Details
Closed on
Aug 5, 2019
Sold by
Mateus George M and Mateus April H
Bought by
Mateus George M
Home Financials for this Owner
Home Financials are based on the most recent Mortgage that was taken out on this home.
Original Mortgage
$188,500
Interest Rate
3.7%
Mortgage Type
New Conventional
Purchase Details
Closed on
Jun 10, 2005
Sold by
Fernandes Pedro D
Bought by
Mateus April H and Mateus George M
Home Financials for this Owner
Home Financials are based on the most recent Mortgage that was taken out on this home.
Original Mortgage
$233,750
Interest Rate
5.79%
Mortgage Type
Purchase Money Mortgage
Create a Home Valuation Report for This Property
The Home Valuation Report is an in-depth analysis detailing your home's value as well as a comparison with similar homes in the area
Home Values in the Area
Average Home Value in this Area
Purchase History
| Date | Buyer | Sale Price | Title Company |
|---|---|---|---|
| Mateus George M | -- | None Available | |
| Mateus George M | -- | -- | |
| Mateus April H | -- | -- |
Source: Public Records
Mortgage History
| Date | Status | Borrower | Loan Amount |
|---|---|---|---|
| Previous Owner | Mateus George M | $188,500 | |
| Previous Owner | Mateus April H | $210,000 | |
| Previous Owner | Mateus April H | $215,000 | |
| Previous Owner | Mateus April H | $233,750 |
Source: Public Records
Tax History
| Year | Tax Paid | Tax Assessment Tax Assessment Total Assessment is a certain percentage of the fair market value that is determined by local assessors to be the total taxable value of land and additions on the property. | Land | Improvement |
|---|---|---|---|---|
| 2025 | $7,953 | $458,400 | $85,400 | $373,000 |
| 2024 | $7,623 | $421,400 | $85,200 | $336,200 |
| 2023 | $7,445 | $381,600 | $74,800 | $306,800 |
| 2022 | $6,969 | $348,600 | $74,800 | $273,800 |
| 2021 | $6,973 | $330,800 | $74,800 | $256,000 |
| 2020 | $6,730 | $326,400 | $73,600 | $252,800 |
| 2019 | $6,402 | $323,000 | $72,900 | $250,100 |
| 2018 | $6,011 | $316,200 | $72,900 | $243,300 |
| 2017 | $5,843 | $315,300 | $71,500 | $243,800 |
| 2016 | $5,802 | $320,000 | $70,100 | $249,900 |
| 2015 | $5,481 | $317,000 | $69,300 | $247,700 |
Source: Public Records
Map
Nearby Homes
- 25 Dale St
- 63 Helene St
- 67 Hill Terrace
- 45 Canterbury St
- 229 Miller St Unit F-13
- 229 Miller St Unit C-1
- 229 Miller St Unit G-3
- 308 Miller St Unit 32
- 308 Miller St Unit 79
- 308 Miller St Unit 78
- 28 Miller St
- 31 Greenwich St
- 87 Haviland St
- 37 Franklin St
- 59 Prospect St
- 70 Sroka Ln
- 287 East St
- 2205 Boston Rd Unit E43
- 2205 Boston Rd Unit M120
- 22 Brainard Rd