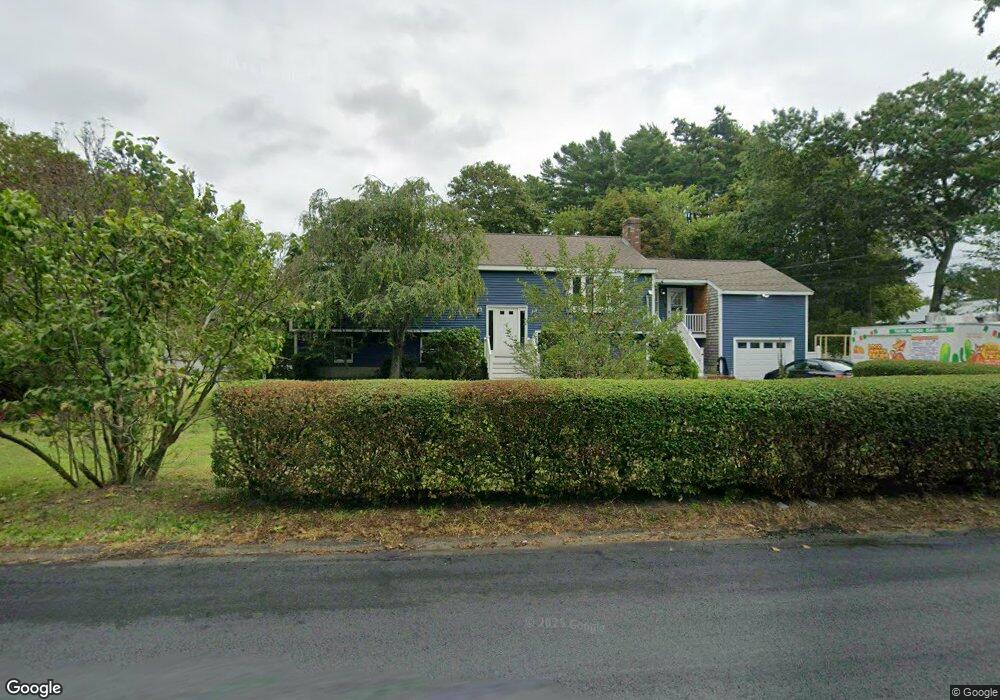
71 Carver St Halifax, MA 02338
Estimated Value: $672,817 - $763,000
5
Beds
2
Baths
1,824
Sq Ft
$397/Sq Ft
Est. Value
About This Home
This home is located at 71 Carver St, Halifax, MA 02338 and is currently estimated at $723,954, approximately $396 per square foot. 71 Carver St is a home located in Plymouth County with nearby schools including Silver Lake Regional High School, Halifax Elementary School, and Silver Lake Regional Middle School.
Ownership History
Date
Name
Owned For
Owner Type
Purchase Details
Closed on
Mar 21, 2025
Sold by
Macdonald Lawrence E and Macdonald Cheryl L
Bought by
Macdonald
Current Estimated Value
Purchase Details
Closed on
Oct 17, 2008
Sold by
Heroux Debra
Bought by
Macdonald Lawrence E and Macdonald Cheryl L
Purchase Details
Closed on
Jul 15, 2008
Sold by
Nomura Home Equity Inc
Bought by
Heroux Debra
Purchase Details
Closed on
Jun 19, 2008
Sold by
Phillips Joseph
Bought by
Equity One
Purchase Details
Closed on
Sep 16, 2005
Sold by
Irving Steven P and Franklin Luann
Bought by
Phillips Joseph
Purchase Details
Closed on
Feb 26, 2003
Sold by
Irving Steven P
Bought by
Irving Steven P and Franklin Luann
Create a Home Valuation Report for This Property
The Home Valuation Report is an in-depth analysis detailing your home's value as well as a comparison with similar homes in the area
Home Values in the Area
Average Home Value in this Area
Purchase History
| Date | Buyer | Sale Price | Title Company |
|---|---|---|---|
| Macdonald | -- | None Available | |
| Macdonald | -- | None Available | |
| Macdonald Lawrence E | $303,000 | -- | |
| Macdonald Lawrence E | $303,000 | -- | |
| Heroux Debra | $170,000 | -- | |
| Heroux Debra | $170,000 | -- | |
| Equity One | $107,716 | -- | |
| Equity One | $107,716 | -- | |
| Phillips Joseph | $460,000 | -- | |
| Phillips Joseph | $460,000 | -- | |
| Irving Steven P | -- | -- | |
| Irving Steven P | -- | -- |
Source: Public Records
Mortgage History
| Date | Status | Borrower | Loan Amount |
|---|---|---|---|
| Previous Owner | Irving Steven P | $300,491 |
Source: Public Records
Tax History
| Year | Tax Paid | Tax Assessment Tax Assessment Total Assessment is a certain percentage of the fair market value that is determined by local assessors to be the total taxable value of land and additions on the property. | Land | Improvement |
|---|---|---|---|---|
| 2025 | $8,160 | $571,800 | $167,300 | $404,500 |
| 2024 | $8,001 | $555,600 | $160,900 | $394,700 |
| 2023 | $7,697 | $517,300 | $156,100 | $361,200 |
| 2022 | $7,477 | $467,000 | $139,400 | $327,600 |
| 2021 | $7,318 | $420,800 | $134,000 | $286,800 |
| 2020 | $7,082 | $406,100 | $134,000 | $272,100 |
| 2019 | $6,953 | $398,000 | $130,200 | $267,800 |
| 2018 | $6,695 | $379,300 | $122,800 | $256,500 |
| 2017 | $6,621 | $357,300 | $122,800 | $234,500 |
| 2016 | $6,374 | $331,100 | $109,100 | $222,000 |
| 2015 | $6,341 | $333,900 | $109,100 | $224,800 |
Source: Public Records
Map
Nearby Homes
- 0 Morse St Unit 73387111
- 780 Old Plymouth St
- 8 10th Ave
- 266 Monponsett St Unit 1103
- 266 Monponsett St Unit 1105
- 266 Monponsett St Unit 1201
- 266 Monponsett St Unit 1208
- 266 Monponsett St Unit 309
- 266 Monponsett St Unit 1108
- 266 Monponsett St Unit 1101
- 266 Monponsett St Unit 1301
- 266 Monponsett St Unit 302
- 266 Monponsett St Unit 303
- 266 Monponsett St Unit 1209
- 265 Monponsett St Unit 2210
- 265 Monponsett St Unit 2203
- 343 Monponsett St
- 148 Lot 1a Elm St
- 8 Hilda Ln
- 151 Plymouth St Unit 151A
- 63 Carver St
- 568 Plymouth St
- 64 Carver St
- 562 Plymouth St
- 58 Carver St
- 49 Carver St
- 54 Carver St
- 546 Plymouth St
- 82 Carver St Unit 82A
- 563 Plymouth St
- 50 Carver St
- LOT 25 Fairway Dr
- LOT 6 Wood St
- LOT 3 Fairway Dr
- B13 Lydon Ln Unit 115
- 592 Plymouth St
- 592 Plymouth St Unit 2
- 592 Plymouth St Unit 1
- 592-592A Plymouth St
- 37 Carver St
Your Personal Tour Guide
Ask me questions while you tour the home.