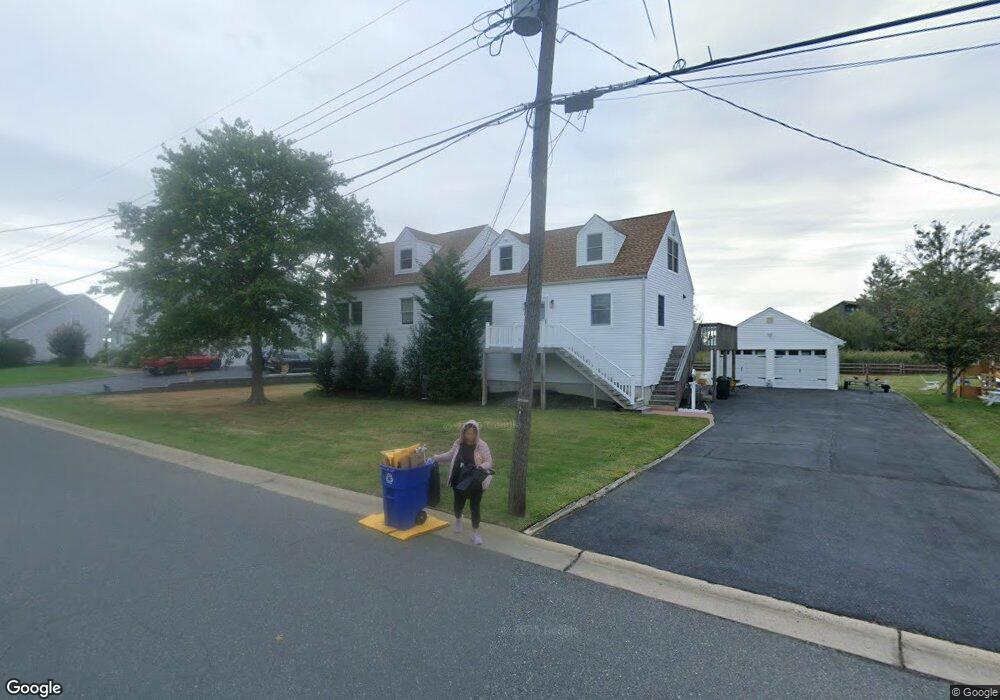
71 Cayuga Ave Oceanport, NJ 07757
Estimated Value: $798,000 - $1,300,000
4
Beds
3
Baths
2,352
Sq Ft
$408/Sq Ft
Est. Value
About This Home
This home is located at 71 Cayuga Ave, Oceanport, NJ 07757 and is currently estimated at $959,596, approximately $407 per square foot. 71 Cayuga Ave is a home located in Monmouth County with nearby schools including Wolf Hill Elementary School, Maple Place Elementary and Middle School, and Shore Regional High School.
Ownership History
Date
Name
Owned For
Owner Type
Purchase Details
Closed on
Nov 16, 2023
Sold by
Gruskos David and Houschild Debra
Bought by
Gruskos Jessica
Current Estimated Value
Home Financials for this Owner
Home Financials are based on the most recent Mortgage that was taken out on this home.
Original Mortgage
$475,000
Outstanding Balance
$466,425
Interest Rate
7.57%
Mortgage Type
New Conventional
Estimated Equity
$493,171
Purchase Details
Closed on
Aug 17, 2021
Sold by
Gately William J and Gately Linda
Bought by
Gruskos David and Houschild Debra
Create a Home Valuation Report for This Property
The Home Valuation Report is an in-depth analysis detailing your home's value as well as a comparison with similar homes in the area
Home Values in the Area
Average Home Value in this Area
Purchase History
| Date | Buyer | Sale Price | Title Company |
|---|---|---|---|
| Gruskos Jessica | $500,000 | Foundation Title | |
| Gruskos Jessica | $500,000 | Foundation Title | |
| Gruskos David | $600,000 | None Available |
Source: Public Records
Mortgage History
| Date | Status | Borrower | Loan Amount |
|---|---|---|---|
| Open | Gruskos Jessica | $475,000 | |
| Closed | Gruskos Jessica | $475,000 |
Source: Public Records
Tax History
| Year | Tax Paid | Tax Assessment Tax Assessment Total Assessment is a certain percentage of the fair market value that is determined by local assessors to be the total taxable value of land and additions on the property. | Land | Improvement |
|---|---|---|---|---|
| 2025 | $10,185 | $686,300 | $404,000 | $282,300 |
| 2024 | $10,475 | $645,000 | $375,000 | $270,000 |
Source: Public Records
Map
Nearby Homes
- 500 Port Au Peck Ave
- 8 Pocahontas Ave
- 568 Shrewsbury Ave
- 5 Marine Place
- 1 Foggia Way
- 580 Patten Ave Unit 72
- 580 Patten Ave Unit 14
- 66 Shrewsbury Ave
- 12 Balmer Ct
- 10 Asbury Ave
- 11 Avon Ave
- 448 Branchport Ave
- 491 Patten Ave
- 29 Shore Dr
- 6 Ellis Ct
- 25 Spaulding Place
- 164 Airsdale Ave
- 3 Bayonne Ave
- 265 Port Au Peck Ave
- 1 Carriage House Ln
Your Personal Tour Guide
Ask me questions while you tour the home.