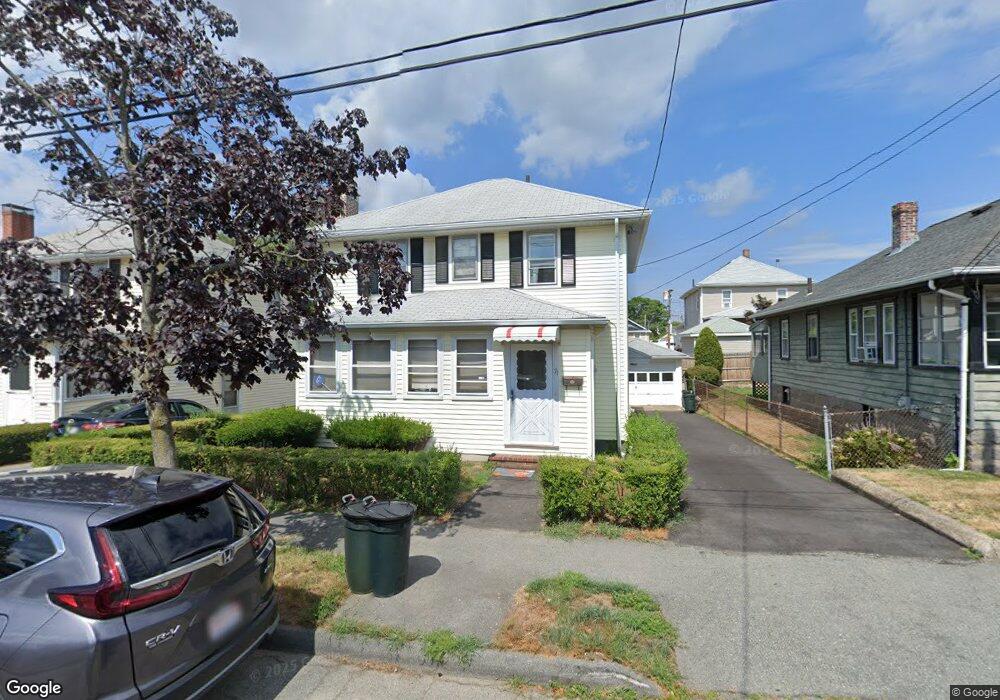
71 Cliff St Quincy, MA 02169
West Quincy NeighborhoodEstimated Value: $662,000 - $738,000
3
Beds
2
Baths
1,248
Sq Ft
$551/Sq Ft
Est. Value
About This Home
This home is located at 71 Cliff St, Quincy, MA 02169 and is currently estimated at $687,913, approximately $551 per square foot. 71 Cliff St is a home located in Norfolk County with nearby schools including Charles A. Bernazzani Elementary School, Central Middle School, and North Quincy High School.
Ownership History
Date
Name
Owned For
Owner Type
Purchase Details
Closed on
Oct 5, 2023
Sold by
Lo Kam H and Fung Lai M
Bought by
Kam Hung Lo Ret and Lo
Current Estimated Value
Purchase Details
Closed on
Jun 7, 1989
Sold by
Kiddy Helen M
Bought by
Lo Kam H
Home Financials for this Owner
Home Financials are based on the most recent Mortgage that was taken out on this home.
Original Mortgage
$100,000
Interest Rate
10.93%
Mortgage Type
Purchase Money Mortgage
Create a Home Valuation Report for This Property
The Home Valuation Report is an in-depth analysis detailing your home's value as well as a comparison with similar homes in the area
Home Values in the Area
Average Home Value in this Area
Purchase History
| Date | Buyer | Sale Price | Title Company |
|---|---|---|---|
| Kam Hung Lo Ret | -- | None Available | |
| Kam Hung Lo Ret | -- | None Available | |
| Lo Kam H | $175,000 | -- |
Source: Public Records
Mortgage History
| Date | Status | Borrower | Loan Amount |
|---|---|---|---|
| Previous Owner | Lo Kam H | $25,000 | |
| Previous Owner | Lo Kam H | $98,000 | |
| Previous Owner | Lo Kam H | $100,000 |
Source: Public Records
Tax History Compared to Growth
Tax History
| Year | Tax Paid | Tax Assessment Tax Assessment Total Assessment is a certain percentage of the fair market value that is determined by local assessors to be the total taxable value of land and additions on the property. | Land | Improvement |
|---|---|---|---|---|
| 2025 | $6,045 | $524,300 | $250,600 | $273,700 |
| 2024 | $5,714 | $507,000 | $238,700 | $268,300 |
| 2023 | $5,311 | $477,200 | $227,300 | $249,900 |
| 2022 | $4,909 | $409,800 | $181,900 | $227,900 |
| 2021 | $4,874 | $401,500 | $181,900 | $219,600 |
| 2020 | $4,711 | $379,000 | $181,900 | $197,100 |
| 2019 | $4,576 | $364,600 | $176,600 | $188,000 |
| 2018 | $4,504 | $337,600 | $163,500 | $174,100 |
| 2017 | $4,449 | $314,000 | $155,700 | $158,300 |
| 2016 | $4,179 | $291,000 | $141,600 | $149,400 |
| 2015 | $3,958 | $271,100 | $133,600 | $137,500 |
| 2014 | $3,837 | $258,200 | $133,600 | $124,600 |
Source: Public Records
Map
Nearby Homes
- 73 Connell St
- 47 Connell St
- 27 Shirley St
- 19 Seymour St
- 64 Willard St Unit 302
- 41 Wallace Rd
- 83 Forbes Hill Rd
- 230 Willard St Unit 204
- 9 Common St Unit 3
- 11 Rockwell Ave
- 141 Gardiner Rd
- 29 Oconnell Ave
- 9 Cross St Unit 11
- 64 Shawmut St
- 328 Copeland St Unit 3E
- 41 Filbert St
- 260 Elmwood Ave
- 145 Suomi Rd Unit C7
- 14 Priscilla Ln
- 89 Puritan Dr