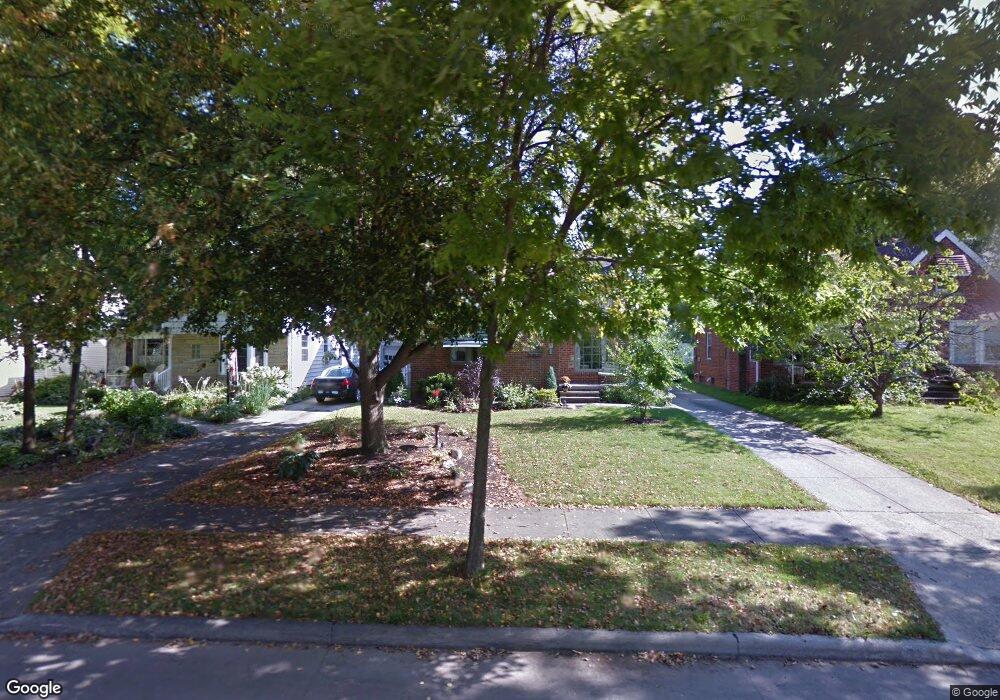
71 E 208th St Euclid, OH 44123
Estimated Value: $156,000 - $190,000
1
Bed
2
Baths
1,440
Sq Ft
$119/Sq Ft
Est. Value
About This Home
This home is located at 71 E 208th St, Euclid, OH 44123 and is currently estimated at $171,070, approximately $118 per square foot. 71 E 208th St is a home located in Cuyahoga County with nearby schools including Arbor Elementary School, Euclid Middle School, and Euclid High School.
Ownership History
Date
Name
Owned For
Owner Type
Purchase Details
Closed on
Oct 25, 2001
Sold by
Gombach Anton L
Bought by
Bennett Steven W
Current Estimated Value
Home Financials for this Owner
Home Financials are based on the most recent Mortgage that was taken out on this home.
Original Mortgage
$78,000
Outstanding Balance
$28,802
Interest Rate
6.88%
Estimated Equity
$142,268
Purchase Details
Closed on
Jun 27, 1988
Sold by
Nash Richard M
Bought by
Gombach Anton L
Purchase Details
Closed on
Feb 24, 1984
Sold by
Nash Richard M and Nash Emma
Bought by
Nash Richard M
Purchase Details
Closed on
Jan 1, 1975
Bought by
Nash Richard M and Nash Emma
Create a Home Valuation Report for This Property
The Home Valuation Report is an in-depth analysis detailing your home's value as well as a comparison with similar homes in the area
Home Values in the Area
Average Home Value in this Area
Purchase History
| Date | Buyer | Sale Price | Title Company |
|---|---|---|---|
| Bennett Steven W | $98,000 | Executive Title Agency Corp | |
| Gombach Anton L | $67,000 | -- | |
| Nash Richard M | -- | -- | |
| Nash Richard M | -- | -- |
Source: Public Records
Mortgage History
| Date | Status | Borrower | Loan Amount |
|---|---|---|---|
| Open | Bennett Steven W | $78,000 | |
| Closed | Bennett Steven W | $15,100 |
Source: Public Records
Tax History
| Year | Tax Paid | Tax Assessment Tax Assessment Total Assessment is a certain percentage of the fair market value that is determined by local assessors to be the total taxable value of land and additions on the property. | Land | Improvement |
|---|---|---|---|---|
| 2025 | $3,647 | $55,055 | $11,795 | $43,260 |
| 2024 | $3,769 | $55,055 | $11,795 | $43,260 |
| 2023 | $3,548 | $41,380 | $9,770 | $31,610 |
| 2022 | $3,466 | $41,370 | $9,770 | $31,610 |
| 2021 | $3,869 | $41,370 | $9,770 | $31,610 |
| 2020 | $3,922 | $38,290 | $9,030 | $29,260 |
| 2019 | $3,531 | $109,400 | $25,800 | $83,600 |
| 2018 | $3,480 | $38,290 | $9,030 | $29,260 |
| 2017 | $3,687 | $33,050 | $7,670 | $25,380 |
| 2016 | $3,695 | $33,050 | $7,670 | $25,380 |
| 2015 | $3,360 | $33,050 | $7,670 | $25,380 |
| 2014 | $3,360 | $33,050 | $7,670 | $25,380 |
Source: Public Records
Map
Nearby Homes
- 144 E 208th St
- 71 E 201st St
- 94 E 217th St
- 226 E 216th St
- 273 E 208th St
- 174 E 200th St
- 324 E 215th St
- 285 E 216th St
- 291 E 204th St
- 170 E 220th St
- 20330 S Lake Shore Blvd
- 80 E 197th St
- 21051 S Lake Shore Blvd
- 336 E 222nd St
- 20700 Crystal Ave
- 275 E 200th St
- 94 E 196th St
- 21000 Crystal Ave
- 20931 Priday Ave
- 20900 Priday Ave
Your Personal Tour Guide
Ask me questions while you tour the home.