Estimated Value: $530,938 - $635,000
3
Beds
2
Baths
1,820
Sq Ft
$322/Sq Ft
Est. Value
About This Home
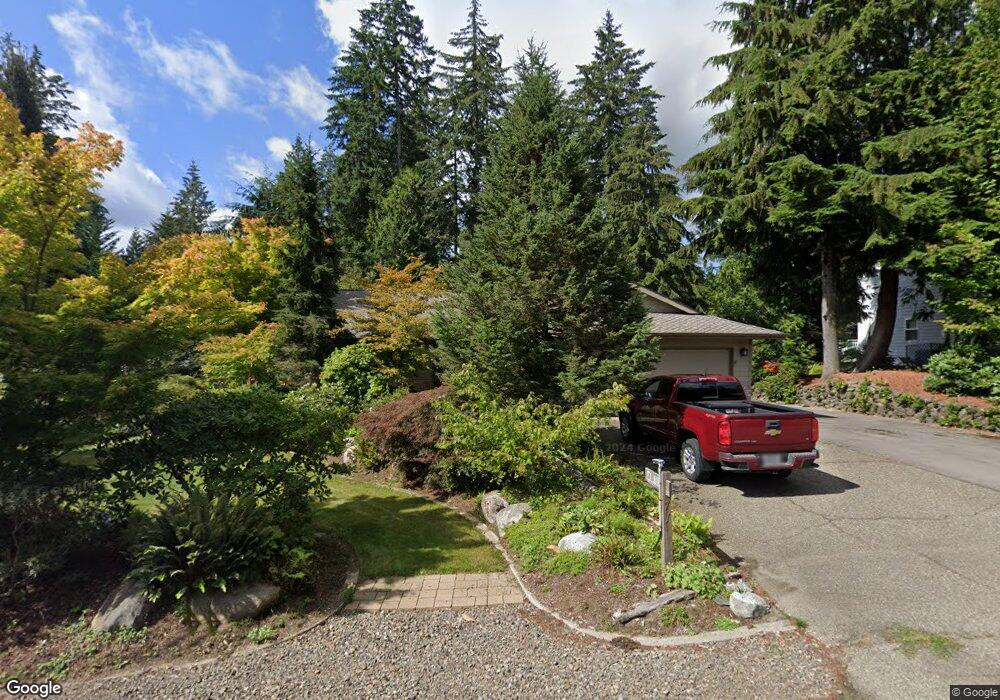
This home is located at 71 E Old Ranch Rd, Allyn, WA 98524 and is currently estimated at $585,235, approximately $321 per square foot. 71 E Old Ranch Rd is a home located in Mason County with nearby schools including North Mason Senior High School.
Create a Home Valuation Report for This Property
The Home Valuation Report is an in-depth analysis detailing your home's value as well as a comparison with similar homes in the area
Home Values in the Area
Average Home Value in this Area
Tax History
| Year | Tax Paid | Tax Assessment Tax Assessment Total Assessment is a certain percentage of the fair market value that is determined by local assessors to be the total taxable value of land and additions on the property. | Land | Improvement |
|---|---|---|---|---|
| 2025 | $3,682 | $479,600 | $81,470 | $398,130 |
| 2023 | $3,682 | $407,540 | $54,860 | $352,680 |
| 2022 | $3,540 | $393,460 | $56,245 | $337,215 |
| 2021 | $3,350 | $393,460 | $56,245 | $337,215 |
| 2020 | $3,490 | $386,230 | $46,870 | $339,360 |
| 2018 | $3,400 | $288,225 | $36,055 | $252,170 |
| 2017 | $3,040 | $288,215 | $36,045 | $252,170 |
| 2016 | $2,617 | $266,010 | $36,045 | $229,965 |
| 2015 | $2,524 | $229,840 | $63,750 | $166,090 |
| 2014 | -- | $224,475 | $62,250 | $162,225 |
| 2013 | -- | $214,500 | $60,000 | $154,500 |
Source: Public Records
Map
Nearby Homes
- 160 E Lakeland Way
- 31 E Village View Dr
- 141 E Hofaker Rd
- 101 E Mountain View Dr
- 200 E Soderberg Rd
- 40 E Lakeshore Dr
- 130 E Olympic Ct
- 160 E Soderberg Rd Unit L32
- 61 E Brady Loop
- 17 E Sellegren Rd
- 0 xxx Wheelwright St N
- 30 E Compass Ln Unit A98524
- 41 E Westlake Place
- 0 E Wheelwright St S
- 140 E Sullivan St
- 371 E Sullivan St
- 0 xxxx E Sullivan St
- 920 E Old Ranch Rd Unit E1
- 181 E Rainier Ct
- 17991 E State Route 3
- 91 E Old Ranch Rd
- 51 E Old Ranch Rd
- 690 E Lakeland Dr
- 31 E Elmas Place
- 710 E Lakeland Dr
- 680 E Lakeland Dr
- 70 E Old Ranch Rd
- 90 E Old Ranch Rd
- 50 E Old Ranch Rd
- 112 E Old Ranch Rd
- 120 E Old Ranch Rd
- 40 Elma's Place
- 10 E Elmas Place
- 691 E Lakeland Dr
- 701 E Lakeland Dr
- 681 E Lakeland Dr
- 730 E Lakeland Dr
- 30 E Old Ranch Rd
- 721 E Lakeland Dr
- 671 E Lakeland Dr
Your Personal Tour Guide
Ask me questions while you tour the home.