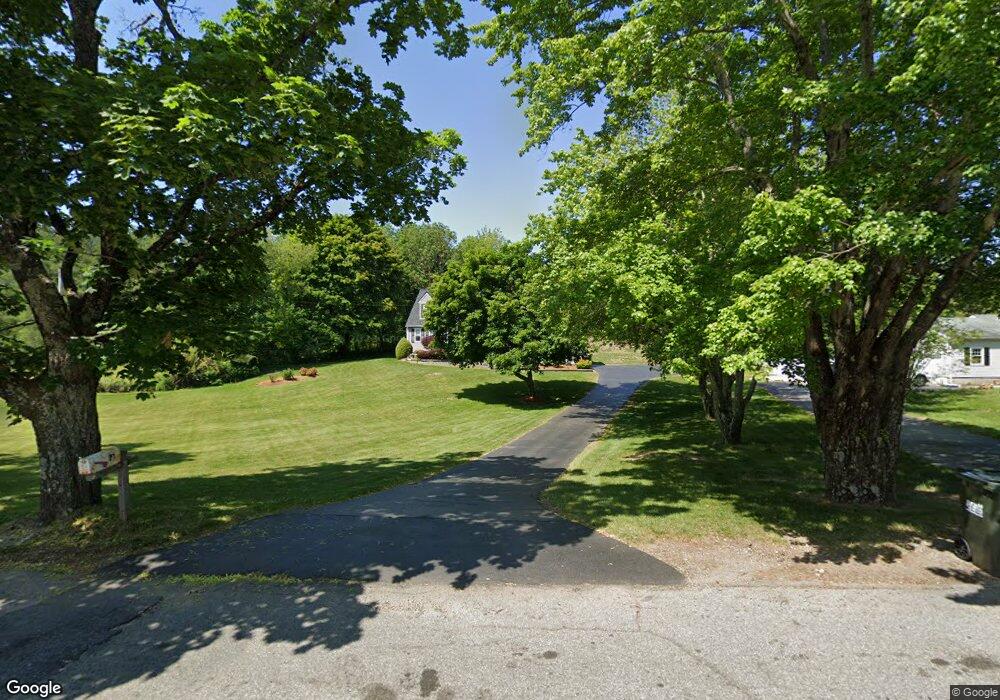
71 Elmdale Rd Uxbridge, MA 01569
Estimated Value: $704,000 - $880,000
3
Beds
3
Baths
2,905
Sq Ft
$260/Sq Ft
Est. Value
About This Home
This home is located at 71 Elmdale Rd, Uxbridge, MA 01569 and is currently estimated at $754,531, approximately $259 per square foot. 71 Elmdale Rd is a home located in Worcester County with nearby schools including Uxbridge High School and Our Lady of the Valley Regional School.
Ownership History
Date
Name
Owned For
Owner Type
Purchase Details
Closed on
May 4, 2000
Sold by
New American Homes Llc
Bought by
Greeson Marc A and Greeson Lori M
Current Estimated Value
Purchase Details
Closed on
Jun 14, 1995
Sold by
Paul Robert and Paul Margaret
Bought by
Paul Robert G
Create a Home Valuation Report for This Property
The Home Valuation Report is an in-depth analysis detailing your home's value as well as a comparison with similar homes in the area
Home Values in the Area
Average Home Value in this Area
Purchase History
| Date | Buyer | Sale Price | Title Company |
|---|---|---|---|
| Greeson Marc A | $302,855 | -- | |
| Paul Robert G | $15,000 | -- |
Source: Public Records
Mortgage History
| Date | Status | Borrower | Loan Amount |
|---|---|---|---|
| Open | Paul Robert G | $122,653 | |
| Closed | Paul Robert G | $100,000 | |
| Closed | Paul Robert G | $30,000 |
Source: Public Records
Tax History
| Year | Tax Paid | Tax Assessment Tax Assessment Total Assessment is a certain percentage of the fair market value that is determined by local assessors to be the total taxable value of land and additions on the property. | Land | Improvement |
|---|---|---|---|---|
| 2025 | $76 | $579,000 | $143,000 | $436,000 |
| 2024 | $7,079 | $547,900 | $131,300 | $416,600 |
| 2023 | $7,275 | $521,500 | $119,100 | $402,400 |
| 2022 | $6,758 | $445,800 | $108,100 | $337,700 |
| 2021 | $6,776 | $428,300 | $103,400 | $324,900 |
| 2020 | $7,019 | $419,300 | $107,400 | $311,900 |
| 2019 | $6,834 | $393,900 | $99,500 | $294,400 |
| 2018 | $6,119 | $356,400 | $99,500 | $256,900 |
| 2017 | $6,241 | $368,000 | $94,000 | $274,000 |
| 2016 | $6,097 | $347,000 | $96,500 | $250,500 |
| 2015 | $5,963 | $342,700 | $96,500 | $246,200 |
Source: Public Records
Map
Nearby Homes
- 107 Henry St
- 223 Mendon St
- 76 Pouts Ln
- 44 Pouts Ln
- 35 Pouts Ln
- 53 Asylum St
- 13A Asylum St
- 79 High St
- 16 Farnum St
- 95 High St Unit C
- 5 Peter St Unit D
- 127 Old Millville Rd
- 197 Crownshield Ave Unit 16B
- 197 Crownshield Ave Unit 16C
- 197 Crownshield Ave Unit 16A
- 314 Richardson St
- 57 Kempton Rd
- 86 Hunter Rd
- 30 Chocolog Rd
- 220 Millville Rd
Your Personal Tour Guide
Ask me questions while you tour the home.