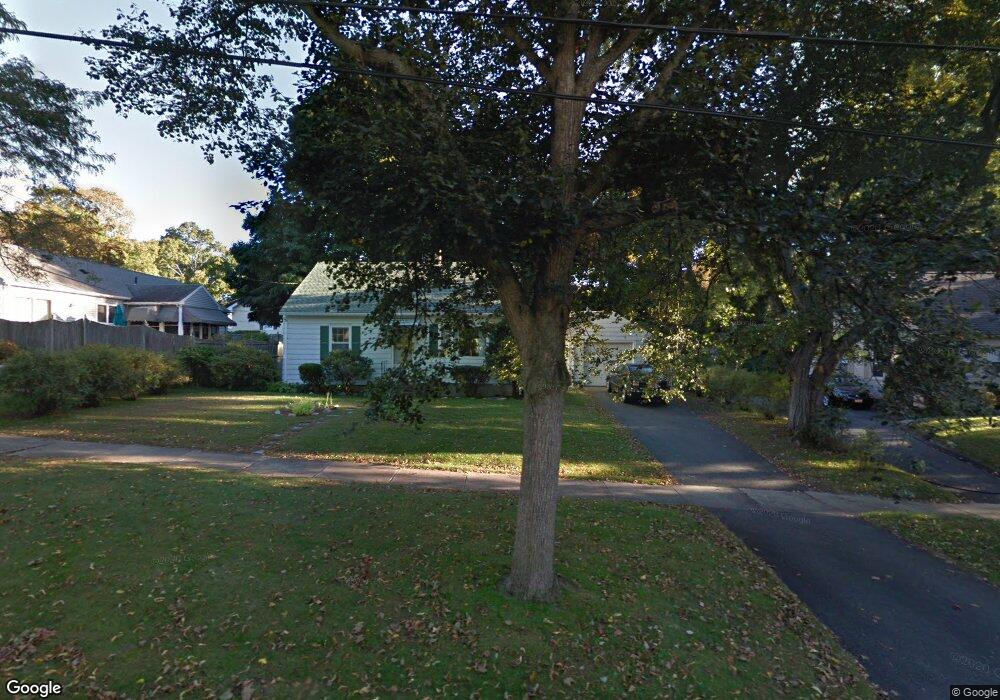
71 Fenimore Blvd Springfield, MA 01108
Forest Park NeighborhoodEstimated Value: $238,000 - $301,000
1
Bed
1
Bath
832
Sq Ft
$312/Sq Ft
Est. Value
About This Home
This home is located at 71 Fenimore Blvd, Springfield, MA 01108 and is currently estimated at $259,573, approximately $311 per square foot. 71 Fenimore Blvd is a home located in Hampden County with nearby schools including Alice B. Beal Elementary School, Forest Park Middle School, and High School Of Commerce.
Ownership History
Date
Name
Owned For
Owner Type
Purchase Details
Closed on
Apr 1, 2003
Sold by
Zeise Doris and Zeise Dorothy Winter
Bought by
Zini Richard R
Current Estimated Value
Home Financials for this Owner
Home Financials are based on the most recent Mortgage that was taken out on this home.
Original Mortgage
$54,100
Outstanding Balance
$23,514
Interest Rate
5.91%
Mortgage Type
Purchase Money Mortgage
Estimated Equity
$236,059
Create a Home Valuation Report for This Property
The Home Valuation Report is an in-depth analysis detailing your home's value as well as a comparison with similar homes in the area
Home Values in the Area
Average Home Value in this Area
Purchase History
| Date | Buyer | Sale Price | Title Company |
|---|---|---|---|
| Zini Richard R | $78,000 | -- |
Source: Public Records
Mortgage History
| Date | Status | Borrower | Loan Amount |
|---|---|---|---|
| Open | Zini Richard R | $54,100 | |
| Closed | Zini Richard R | $20,000 |
Source: Public Records
Tax History
| Year | Tax Paid | Tax Assessment Tax Assessment Total Assessment is a certain percentage of the fair market value that is determined by local assessors to be the total taxable value of land and additions on the property. | Land | Improvement |
|---|---|---|---|---|
| 2025 | $3,246 | $207,000 | $47,700 | $159,300 |
| 2024 | $3,352 | $208,700 | $47,700 | $161,000 |
| 2023 | $3,188 | $187,000 | $40,300 | $146,700 |
| 2022 | $2,940 | $156,200 | $40,300 | $115,900 |
| 2021 | $2,767 | $146,400 | $36,700 | $109,700 |
| 2020 | $2,763 | $141,500 | $36,700 | $104,800 |
| 2019 | $2,728 | $138,600 | $36,700 | $101,900 |
| 2018 | $2,362 | $120,000 | $36,700 | $83,300 |
| 2017 | $2,436 | $123,900 | $36,700 | $87,200 |
| 2016 | $2,265 | $115,200 | $36,700 | $78,500 |
| 2015 | $2,101 | $106,800 | $36,700 | $70,100 |
Source: Public Records
Map
Nearby Homes
- 5 Fenimore Blvd
- 23 Fairway Dr
- 78 Wood Ave
- 137 Carroll St
- 132 Carroll St
- 179 Carver St
- 26 Dwight Rd
- 115 Tiffany St
- 33-35 Ruskin St
- 0 Donald Ave
- 12 Carroll St
- 22 Eleanor Rd
- 114 Sylvan St Unit 116
- 104 Appleton St
- 134-136 Woodlawn St
- 62 Cooley Ave
- 58 Appleton St
- 914-916 Belmont Ave
- 35 Carlton St
- 1155 Dickinson St
- 84 Cooper St
- 79 Fenimore Blvd
- 74 Mayfield St
- 94 Cooper St
- 85 Fenimore Blvd
- 86 Mayfield St
- 72 Fenimore Blvd
- 51 Fenimore Blvd
- 80 Fenimore Blvd
- 64 Fenimore Blvd
- 95 Fenimore Blvd
- 86 Fenimore Blvd
- 50 Fenimore Blvd
- 96 Mayfield St
- 44 Mayfield St
- 73 Weymouth St
- 71 Mayfield St
- 65 Weymouth St
- 81 Weymouth St
- 79 Mayfield St
Your Personal Tour Guide
Ask me questions while you tour the home.