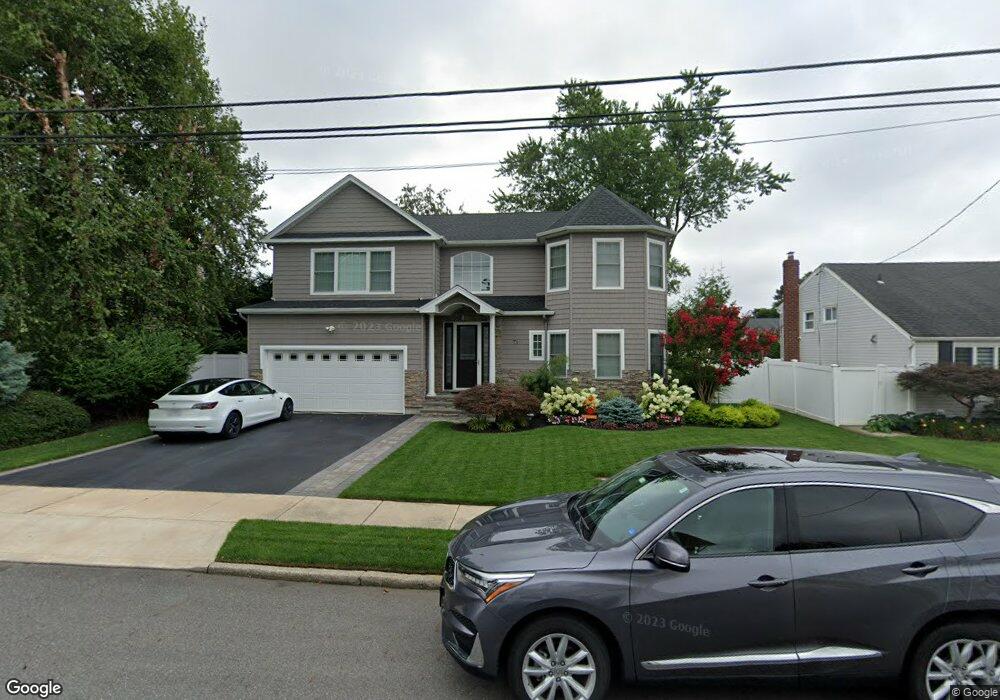
71 Floral Dr W Plainview, NY 11803
Estimated Value: $1,562,000 - $1,617,246
5
Beds
3
Baths
3,000
Sq Ft
$530/Sq Ft
Est. Value
About This Home
This home is located at 71 Floral Dr W, Plainview, NY 11803 and is currently estimated at $1,589,623, approximately $529 per square foot. 71 Floral Dr W is a home located in Nassau County with nearby schools including Stratford Road School, H B Mattlin Middle School, and Plainview-Old Bethpage John F. Kennedy High School.
Ownership History
Date
Name
Owned For
Owner Type
Purchase Details
Closed on
Dec 7, 2017
Sold by
Ridan Management Llc
Bought by
Mccready Francine and Mccready James
Current Estimated Value
Home Financials for this Owner
Home Financials are based on the most recent Mortgage that was taken out on this home.
Original Mortgage
$350,000
Outstanding Balance
$192,654
Interest Rate
3.9%
Mortgage Type
New Conventional
Estimated Equity
$1,396,969
Purchase Details
Closed on
Jul 13, 2016
Sold by
Bank Of New York Mellon Series 2005 32T1
Bought by
Ridan Management Llc
Purchase Details
Closed on
Aug 20, 2015
Sold by
Referees Of Nassau County and Ricciardi Esq
Bought by
Bank Of New York Mellon Series 2005-32Ti
Purchase Details
Closed on
May 24, 2005
Sold by
Rosen Diane
Bought by
Hong In
Create a Home Valuation Report for This Property
The Home Valuation Report is an in-depth analysis detailing your home's value as well as a comparison with similar homes in the area
Home Values in the Area
Average Home Value in this Area
Purchase History
| Date | Buyer | Sale Price | Title Company |
|---|---|---|---|
| Mccready Francine | -- | -- | |
| Mccready Francine | -- | -- | |
| Mccready Francine | -- | -- | |
| Ridan Management Llc | $435,000 | None Available | |
| Ridan Management Llc | $435,000 | None Available | |
| Ridan Management Llc | $435,000 | None Available | |
| Bank Of New York Mellon Series 2005-32Ti | $500 | Web Title Agency | |
| Bank Of New York Mellon Series 2005-32Ti | $500 | Web Title Agency | |
| Bank Of New York Mellon Series 2005 & 32Ti | $500 | Web Title Agency | |
| Hong In | $535,000 | -- | |
| Hong In | $535,000 | -- |
Source: Public Records
Mortgage History
| Date | Status | Borrower | Loan Amount |
|---|---|---|---|
| Open | Mccready Francine | $350,000 | |
| Closed | Mccready Francine | $350,000 | |
| Closed | Bank Of New York Mellon Series 2005 & 32Ti | $0 |
Source: Public Records
Tax History
| Year | Tax Paid | Tax Assessment Tax Assessment Total Assessment is a certain percentage of the fair market value that is determined by local assessors to be the total taxable value of land and additions on the property. | Land | Improvement |
|---|---|---|---|---|
| 2025 | $23,584 | $857 | $320 | $537 |
| 2024 | $7,486 | $923 | $345 | $578 |
Source: Public Records
Map
Nearby Homes
Your Personal Tour Guide
Ask me questions while you tour the home.