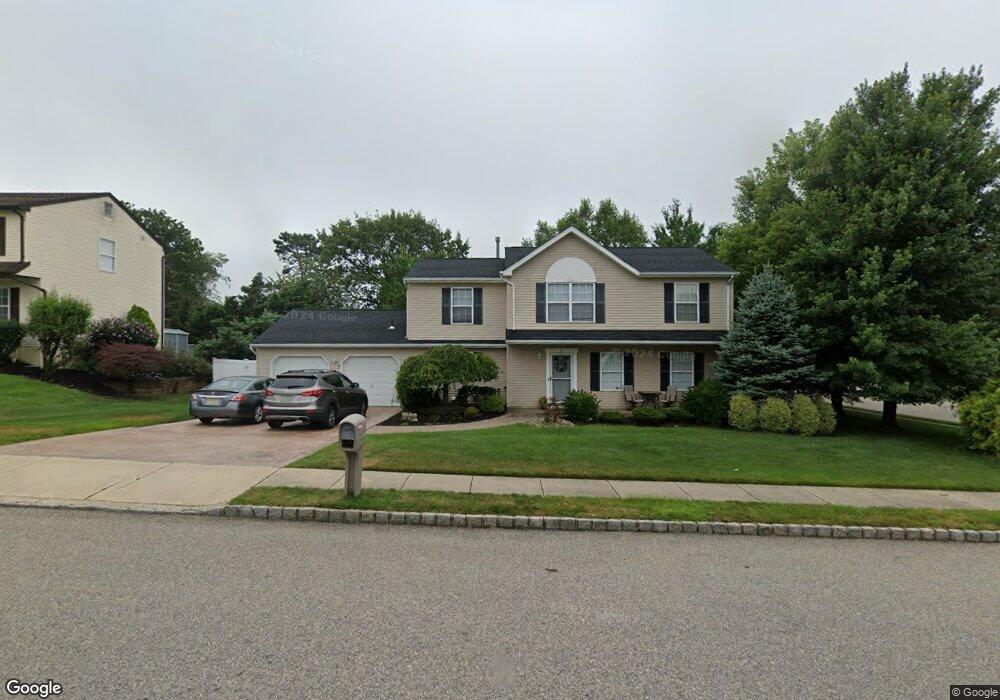
71 Gladiola Dr Howell, NJ 07731
Ramtown NeighborhoodEstimated Value: $679,496 - $776,000
4
Beds
3
Baths
2,044
Sq Ft
$354/Sq Ft
Est. Value
About This Home
This home is located at 71 Gladiola Dr, Howell, NJ 07731 and is currently estimated at $722,874, approximately $353 per square foot. 71 Gladiola Dr is a home located in Monmouth County with nearby schools including Ramtown School, Greenville School, and Howell Township Middle School South.
Ownership History
Date
Name
Owned For
Owner Type
Purchase Details
Closed on
Jul 1, 2010
Sold by
Moss John and Moss Geralyn
Bought by
Martino David M and Martino Pamela L
Current Estimated Value
Home Financials for this Owner
Home Financials are based on the most recent Mortgage that was taken out on this home.
Original Mortgage
$335,380
Outstanding Balance
$231,379
Interest Rate
5.5%
Mortgage Type
FHA
Estimated Equity
$491,495
Purchase Details
Closed on
Jul 31, 2000
Sold by
Fitzpatrick Michael
Bought by
Moss John and Moss Geralyn
Home Financials for this Owner
Home Financials are based on the most recent Mortgage that was taken out on this home.
Original Mortgage
$182,750
Interest Rate
8.21%
Purchase Details
Closed on
Jan 31, 1995
Sold by
Howell Properties
Bought by
Fitzpatrick Michael and Fitzpatrick Laura
Home Financials for this Owner
Home Financials are based on the most recent Mortgage that was taken out on this home.
Original Mortgage
$137,000
Interest Rate
9.17%
Create a Home Valuation Report for This Property
The Home Valuation Report is an in-depth analysis detailing your home's value as well as a comparison with similar homes in the area
Home Values in the Area
Average Home Value in this Area
Purchase History
| Date | Buyer | Sale Price | Title Company |
|---|---|---|---|
| Martino David M | $348,000 | Lawyers Title Insurance Corp | |
| Moss John | $215,000 | -- | |
| Moss John | $215,000 | -- | |
| Fitzpatrick Michael | $153,190 | -- |
Source: Public Records
Mortgage History
| Date | Status | Borrower | Loan Amount |
|---|---|---|---|
| Open | Martino David M | $335,380 | |
| Previous Owner | Moss John | $182,750 | |
| Previous Owner | Moss John | $192,000 | |
| Previous Owner | Fitzpatrick Michael | $137,000 |
Source: Public Records
Tax History Compared to Growth
Tax History
| Year | Tax Paid | Tax Assessment Tax Assessment Total Assessment is a certain percentage of the fair market value that is determined by local assessors to be the total taxable value of land and additions on the property. | Land | Improvement |
|---|---|---|---|---|
| 2025 | $9,445 | $578,200 | $311,100 | $267,100 |
| 2024 | $9,801 | $533,300 | $271,100 | $262,200 |
| 2023 | $9,801 | $527,200 | $271,100 | $256,100 |
| 2022 | $8,468 | $464,200 | $201,100 | $263,100 |
| 2021 | $8,201 | $370,100 | $136,100 | $234,000 |
| 2020 | $8,201 | $354,400 | $123,100 | $231,300 |
| 2019 | $7,918 | $335,800 | $108,400 | $227,400 |
| 2018 | $7,707 | $325,200 | $108,400 | $216,800 |
| 2017 | $7,637 | $318,600 | $108,400 | $210,200 |
| 2016 | $7,733 | $318,500 | $113,600 | $204,900 |
| 2015 | $7,931 | $323,200 | $121,100 | $202,100 |
| 2014 | $7,046 | $266,500 | $98,200 | $168,300 |
Source: Public Records
Map
Nearby Homes
- 11 Desiree Ct
- 2529 Allenwood Lakewood Rd
- 2 Higgins Ct
- 1 William Dr
- 31 Crater Lake Rd
- 21 Silver Maple Ln
- 23 Snowberry Ln
- 15 Bristlecone Dr
- 17 Bristlecone Dr
- 20 Snowberry Ln
- 50 Little Leaf Ln
- 22 Abraham Dr
- 24 Abraham Dr
- 24 Little Leaf Ln
- 36 Bristlecone Dr
- 822 Lexington Dr
- 4040 Herbertsville Rd
- 174 Ramtown Greenville Rd
- 49 Davids Ln
- 13 Ivy Place