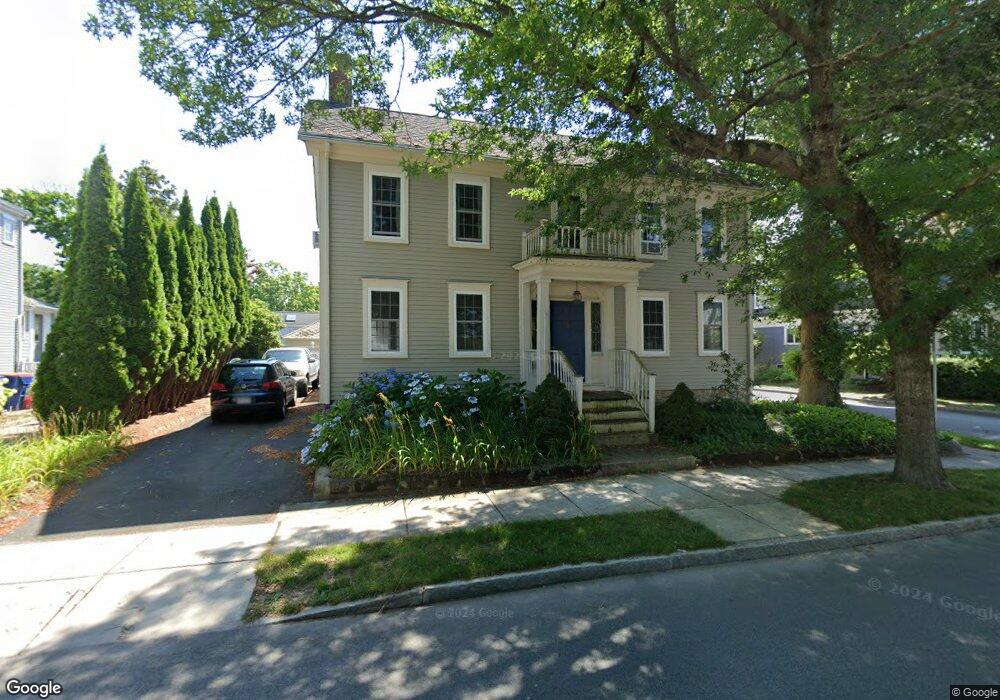
71 Green St Fairhaven, MA 02719
Estimated Value: $663,000 - $1,097,000
5
Beds
3
Baths
3,632
Sq Ft
$245/Sq Ft
Est. Value
About This Home
This home is located at 71 Green St, Fairhaven, MA 02719 and is currently estimated at $889,321, approximately $244 per square foot. 71 Green St is a home located in Bristol County with nearby schools including Fairhaven High School, City On A Hill Charter Public School New Bedford, and St. Joseph School.
Ownership History
Date
Name
Owned For
Owner Type
Purchase Details
Closed on
Aug 24, 2023
Sold by
Craig Alastair M and Craig Angela C
Bought by
Alastair M Craig T M and Alastair Craig
Current Estimated Value
Purchase Details
Closed on
Jul 11, 2003
Sold by
Craig Alastair M and Craig Angela C
Bought by
71 Green Street Nt and Craig
Home Financials for this Owner
Home Financials are based on the most recent Mortgage that was taken out on this home.
Original Mortgage
$296,500
Interest Rate
5.45%
Mortgage Type
Purchase Money Mortgage
Purchase Details
Closed on
Mar 22, 2001
Sold by
Andrews Ann Roberta
Bought by
Craig Alastair M and Craig Angela C
Purchase Details
Closed on
Jun 30, 1997
Sold by
Shor Andrew M and Shor Ann E
Bought by
Andrews Ann Roberta
Purchase Details
Closed on
Apr 2, 1992
Sold by
Blouin Roland E and Blouin Roland E
Bought by
Shor Andrew M and Shor Ann E
Create a Home Valuation Report for This Property
The Home Valuation Report is an in-depth analysis detailing your home's value as well as a comparison with similar homes in the area
Home Values in the Area
Average Home Value in this Area
Purchase History
We collect this data history from publicly available records. To have your information removed, we recommend requesting removal directly through your county’s website.
| Date | Buyer | Sale Price | Title Company |
|---|---|---|---|
| Alastair M Craig T M | -- | None Available | |
| 71 Green Street Nt | -- | -- | |
| Craig Alastair M | -- | -- | |
| Craig Alastair M | $395,000 | -- | |
| Andrews Ann Roberta | $180,000 | -- | |
| Shor Andrew M | $173,000 | -- |
Source: Public Records
Mortgage History
We collect this data history from publicly available records. To have your information removed, we recommend requesting removal directly through your county’s website.
| Date | Status | Borrower | Loan Amount |
|---|---|---|---|
| Previous Owner | Shor Andrew M | $296,500 | |
| Previous Owner | Shor Andrew M | $300,700 |
Source: Public Records
Tax History
| Year | Tax Paid | Tax Assessment Tax Assessment Total Assessment is a certain percentage of the fair market value that is determined by local assessors to be the total taxable value of land and additions on the property. | Land | Improvement |
|---|---|---|---|---|
| 2025 | $62 | $662,200 | $241,200 | $421,000 |
| 2024 | $6,022 | $652,400 | $241,200 | $411,200 |
| 2023 | $5,798 | $582,700 | $208,100 | $374,600 |
| 2022 | $5,464 | $534,600 | $189,500 | $345,100 |
| 2021 | $5,323 | $471,500 | $172,300 | $299,200 |
| 2020 | $7,203 | $471,500 | $172,300 | $299,200 |
| 2019 | $5,032 | $431,200 | $147,600 | $283,600 |
| 2018 | $4,997 | $413,100 | $140,500 | $272,600 |
| 2017 | $4,814 | $399,800 | $135,200 | $264,600 |
| 2016 | $4,379 | $359,500 | $132,500 | $227,000 |
| 2015 | $4,325 | $356,000 | $132,500 | $223,500 |
Source: Public Records
Map
Nearby Homes
- 101 Green St
- 58 Washington St
- 2 Washburn Ave
- 8 Washington St
- 8 Washington St
- 0 Morey Ln
- lot 1 173 Spring St
- 59 Bridge St
- 181 Manor Drive Lot 8x
- 181 Manor Drive Lot B
- 138 Main St Unit 13
- 181 Washington St
- 58 Bayview Ave
- 15 Shirley St
- 27 Bayview Ave
- 30 Centre St Unit 2
- 9 Brae Rd
- 20 Manhattan Ave
- 24 Harvard St
- 5 Tallman Ln
Your Personal Tour Guide
Ask me questions while you tour the home.