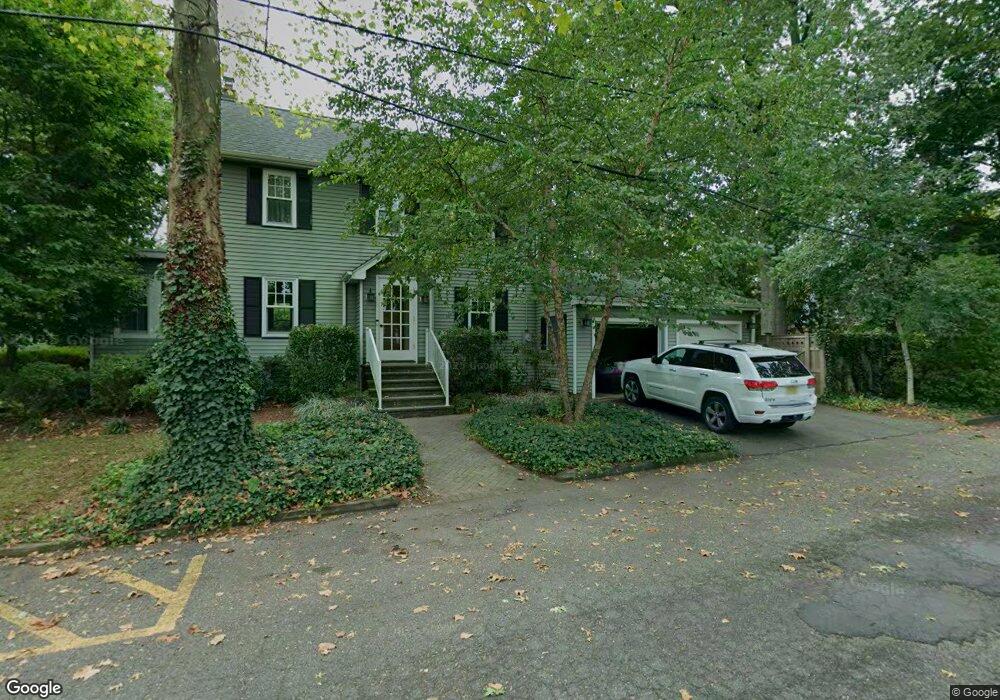
71 Hanson Ave Metuchen, NJ 08840
Estimated Value: $674,000 - $810,000
--
Bed
--
Bath
1,432
Sq Ft
$513/Sq Ft
Est. Value
About This Home
This home is located at 71 Hanson Ave, Metuchen, NJ 08840 and is currently estimated at $735,167, approximately $513 per square foot. 71 Hanson Ave is a home located in Middlesex County with nearby schools including Edgar Middle School, Campbell Elementary School, and Metuchen High School.
Ownership History
Date
Name
Owned For
Owner Type
Purchase Details
Closed on
Aug 11, 2004
Sold by
Roberts Nigel
Bought by
Dereka Andrew and Dereka Jennifer Lynn
Current Estimated Value
Home Financials for this Owner
Home Financials are based on the most recent Mortgage that was taken out on this home.
Original Mortgage
$368,000
Outstanding Balance
$183,455
Interest Rate
6.08%
Estimated Equity
$551,712
Purchase Details
Closed on
Sep 29, 1993
Sold by
Niemeyer Fred
Bought by
Roberts Nigel and Roberts Pamla
Home Financials for this Owner
Home Financials are based on the most recent Mortgage that was taken out on this home.
Original Mortgage
$105,000
Interest Rate
6.87%
Create a Home Valuation Report for This Property
The Home Valuation Report is an in-depth analysis detailing your home's value as well as a comparison with similar homes in the area
Home Values in the Area
Average Home Value in this Area
Purchase History
| Date | Buyer | Sale Price | Title Company |
|---|---|---|---|
| Dereka Andrew | $460,000 | -- | |
| Roberts Nigel | $207,000 | -- |
Source: Public Records
Mortgage History
| Date | Status | Borrower | Loan Amount |
|---|---|---|---|
| Open | Dereka Andrew | $368,000 | |
| Previous Owner | Roberts Nigel | $105,000 |
Source: Public Records
Tax History Compared to Growth
Tax History
| Year | Tax Paid | Tax Assessment Tax Assessment Total Assessment is a certain percentage of the fair market value that is determined by local assessors to be the total taxable value of land and additions on the property. | Land | Improvement |
|---|---|---|---|---|
| 2025 | $12,797 | $184,000 | $85,000 | $99,000 |
| 2024 | $12,368 | $184,000 | $85,000 | $99,000 |
| 2023 | $12,368 | $184,000 | $85,000 | $99,000 |
| 2022 | $11,723 | $184,000 | $85,000 | $99,000 |
| 2021 | $8,540 | $184,000 | $85,000 | $99,000 |
| 2020 | $11,303 | $184,000 | $85,000 | $99,000 |
| 2019 | $10,970 | $184,000 | $85,000 | $99,000 |
| 2018 | $10,930 | $184,000 | $85,000 | $99,000 |
| 2017 | $10,895 | $184,000 | $85,000 | $99,000 |
| 2016 | $10,501 | $182,000 | $85,000 | $97,000 |
| 2015 | $10,268 | $182,000 | $85,000 | $97,000 |
| 2014 | $10,012 | $182,000 | $85,000 | $97,000 |
Source: Public Records
Map
Nearby Homes