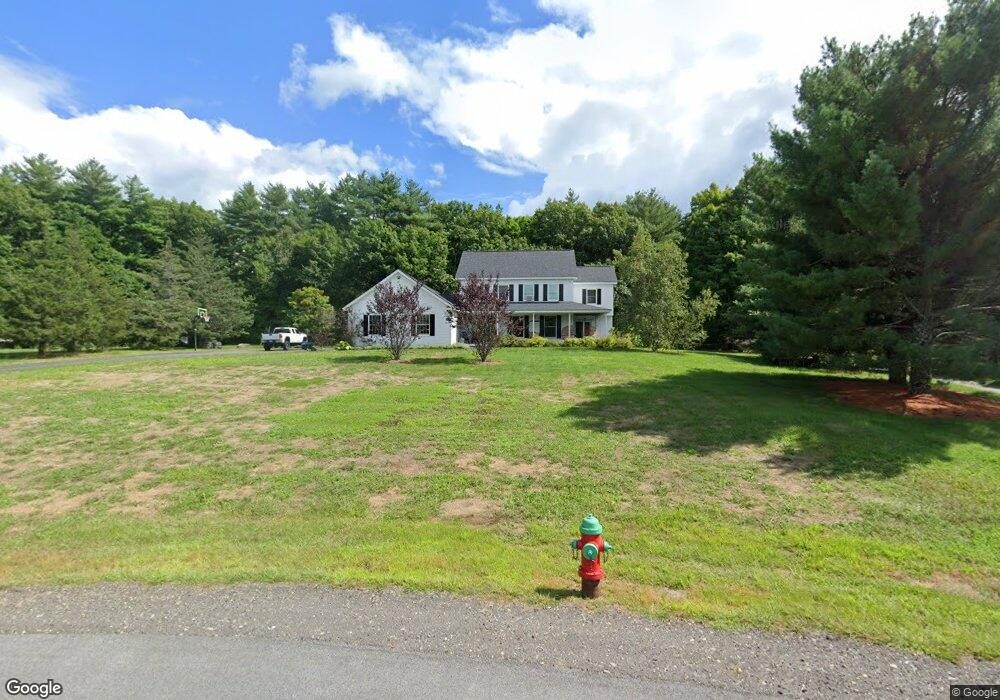
71 Hemlock Ct Newfields, NH 03856
Newfields AreaEstimated Value: $964,000 - $1,222,000
About This Home
This home is located at 71 Hemlock Ct, Newfields, NH 03856 and is currently estimated at $1,101,618, approximately $307 per square foot. 71 Hemlock Ct is a home located in Rockingham County with nearby schools including Newfields Elementary School, Cooperative Middle School, and Exeter High School.
Ownership History
We collect this data history from publicly available records. To have your information removed, we recommend requesting removal directly through your county’s website.
Purchase Details
Home Values in the Area
Average Home Value in this Area
Purchase History
We collect this data history from publicly available records. To have your information removed, we recommend requesting removal directly through your county’s website.
| Date | Buyer | Sale Price | Title Company |
|---|---|---|---|
| $510,000 | -- |
Mortgage History
We collect this data history from publicly available records. To have your information removed, we recommend requesting removal directly through your county’s website.
| Date | Status | Borrower | Loan Amount |
|---|---|---|---|
| Open | $300,000 | ||
| Closed | $50,000 | ||
| Closed | $297,300 | ||
| Closed | $360,000 | ||
| Previous Owner | $75,000 |
Tax History
We collect this data history from publicly available records. To have your information removed, we recommend requesting removal directly through your county’s website.
| Year | Tax Paid | Tax Assessment Tax Assessment Total Assessment is a certain percentage of the fair market value that is determined by local assessors to be the total taxable value of land and additions on the property. | Land | Improvement |
|---|---|---|---|---|
| 2025 | $13,543 | $799,000 | $264,700 | $534,300 |
| 2024 | $12,856 | $799,000 | $264,700 | $534,300 |
| 2023 | $12,616 | $799,000 | $264,700 | $534,300 |
| 2022 | $11,316 | $539,900 | $193,400 | $346,500 |
| 2021 | $11,095 | $539,900 | $193,400 | $346,500 |
| 2020 | $11,467 | $539,900 | $193,400 | $346,500 |
| 2019 | $11,117 | $539,900 | $193,400 | $346,500 |
| 2018 | $10,717 | $539,900 | $193,400 | $346,500 |
| 2017 | $10,921 | $456,200 | $193,000 | $263,200 |
| 2016 | $10,593 | $456,200 | $193,000 | $263,200 |
| 2015 | $10,506 | $456,200 | $193,000 | $263,200 |
| 2014 | $11,148 | $459,700 | $193,000 | $266,700 |
| 2013 | $11,162 | $459,700 | $193,000 | $266,700 |
Map
- 120 Exeter Rd
- 85 College Rd
- 68 Route 108
- 36 Bassett Ln
- 43 Bassett Ln
- 104 Piscassic Rd
- 63 Peninsula Dr
- 21 Peninsula Dr
- 5 Firefly Landing
- 29 Overlook Dr
- 00 Piscassic & Oaklands Rd Unit 1
- 33 Chisholm Farm Dr
- 23 Winding Brook Dr
- 23 Chisholm Farm Dr
- 14 Winding Brook Dr
- 14 Legacy Ln
- 11 Legacy Ln
- 3 Oak Ln
- 6 Stonewall Way Unit C
- 156 Portsmouth Ave Unit 156A-B-C-D-E-F-G-H
Ask me questions while you tour the home.