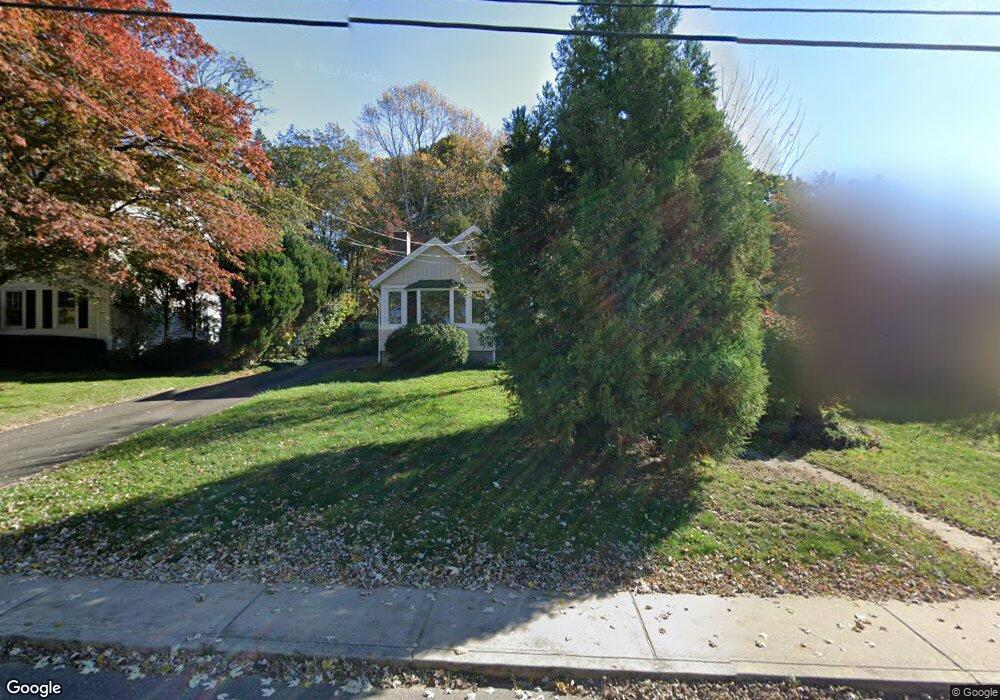
71 High St Deep River, CT 06417
Estimated Value: $367,000 - $395,000
3
Beds
3
Baths
1,500
Sq Ft
$253/Sq Ft
Est. Value
About This Home
This home is located at 71 High St, Deep River, CT 06417 and is currently estimated at $379,577, approximately $253 per square foot. 71 High St is a home located in Middlesex County with nearby schools including Valley Regional High School.
Ownership History
Date
Name
Owned For
Owner Type
Purchase Details
Closed on
Mar 23, 2007
Sold by
Selly Ryan and Selly Angela
Bought by
Manning Jane
Current Estimated Value
Home Financials for this Owner
Home Financials are based on the most recent Mortgage that was taken out on this home.
Original Mortgage
$110,000
Outstanding Balance
$66,506
Interest Rate
6.33%
Estimated Equity
$313,071
Purchase Details
Closed on
Apr 1, 2004
Sold by
Grohs Donald and Grohs Evelyn
Bought by
Thunberg Kenneth
Home Financials for this Owner
Home Financials are based on the most recent Mortgage that was taken out on this home.
Original Mortgage
$220,000
Interest Rate
5.56%
Create a Home Valuation Report for This Property
The Home Valuation Report is an in-depth analysis detailing your home's value as well as a comparison with similar homes in the area
Home Values in the Area
Average Home Value in this Area
Purchase History
| Date | Buyer | Sale Price | Title Company |
|---|---|---|---|
| Manning Jane | $259,000 | -- | |
| Thunberg Kenneth | $220,000 | -- |
Source: Public Records
Mortgage History
| Date | Status | Borrower | Loan Amount |
|---|---|---|---|
| Closed | Thunberg Kenneth | $25,000 | |
| Open | Thunberg Kenneth | $110,000 | |
| Previous Owner | Thunberg Kenneth | $220,000 |
Source: Public Records
Tax History
| Year | Tax Paid | Tax Assessment Tax Assessment Total Assessment is a certain percentage of the fair market value that is determined by local assessors to be the total taxable value of land and additions on the property. | Land | Improvement |
|---|---|---|---|---|
| 2025 | $4,663 | $145,810 | $44,170 | $101,640 |
| 2024 | $4,576 | $145,810 | $44,170 | $101,640 |
| 2023 | $4,357 | $145,810 | $44,170 | $101,640 |
| 2022 | $4,226 | $145,810 | $44,170 | $101,640 |
| 2021 | $4,313 | $145,810 | $44,170 | $101,640 |
| 2020 | $3,940 | $131,390 | $44,940 | $86,450 |
| 2019 | $3,851 | $130,900 | $44,940 | $85,960 |
| 2018 | $3,441 | $116,970 | $44,940 | $72,030 |
| 2017 | $3,383 | $116,970 | $44,940 | $72,030 |
| 2016 | $3,220 | $116,970 | $44,940 | $72,030 |
| 2015 | $3,289 | $125,160 | $49,910 | $75,250 |
| 2014 | $3,239 | $125,160 | $49,910 | $75,250 |
Source: Public Records
Map
Nearby Homes
Your Personal Tour Guide
Ask me questions while you tour the home.