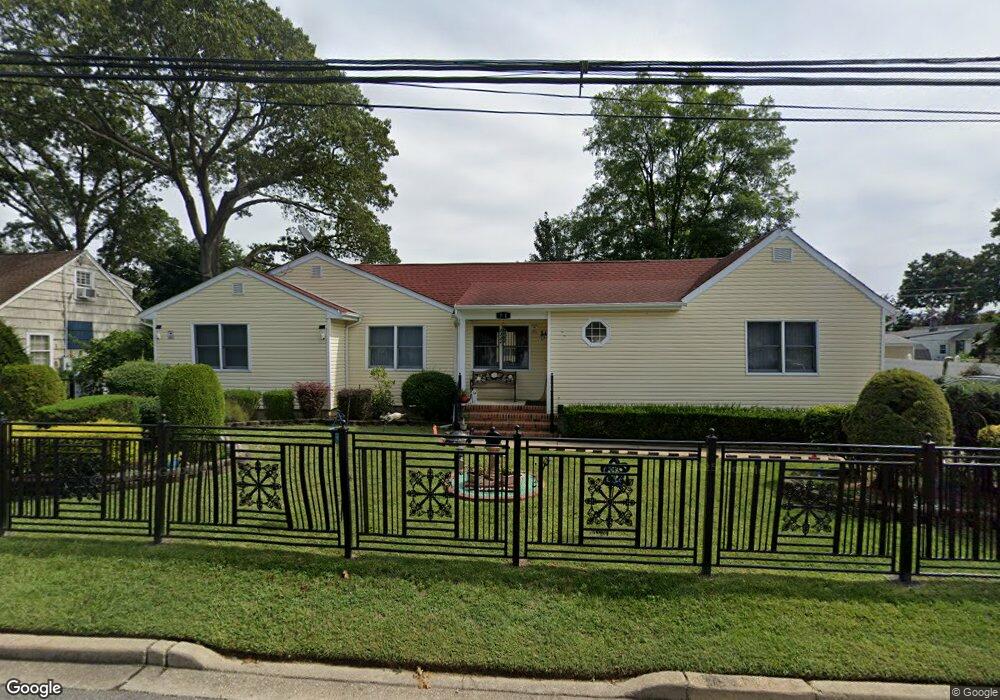
71 Kenwood Ave Massapequa, NY 11758
Estimated Value: $651,000 - $667,024
--
Bed
2
Baths
1,696
Sq Ft
$389/Sq Ft
Est. Value
About This Home
This home is located at 71 Kenwood Ave, Massapequa, NY 11758 and is currently estimated at $659,012, approximately $388 per square foot. 71 Kenwood Ave is a home located in Nassau County with nearby schools including Northeast Elementary School, Northwest Elementary School, and Park Avenue Memorial Elementary School.
Ownership History
Date
Name
Owned For
Owner Type
Purchase Details
Closed on
Sep 2, 2011
Sold by
Glover David and Glover Hazel
Bought by
Zhang Jing Ming
Current Estimated Value
Home Financials for this Owner
Home Financials are based on the most recent Mortgage that was taken out on this home.
Original Mortgage
$161,000
Outstanding Balance
$110,882
Interest Rate
4.38%
Mortgage Type
Purchase Money Mortgage
Estimated Equity
$548,130
Purchase Details
Closed on
Nov 9, 1998
Sold by
Garofalo Edwin and Garofalo Patricia
Bought by
Glover David and Glover Hazel
Create a Home Valuation Report for This Property
The Home Valuation Report is an in-depth analysis detailing your home's value as well as a comparison with similar homes in the area
Home Values in the Area
Average Home Value in this Area
Purchase History
| Date | Buyer | Sale Price | Title Company |
|---|---|---|---|
| Zhang Jing Ming | $280,000 | -- | |
| Glover David | $178,250 | -- |
Source: Public Records
Mortgage History
| Date | Status | Borrower | Loan Amount |
|---|---|---|---|
| Open | Zhang Jing Ming | $161,000 |
Source: Public Records
Tax History Compared to Growth
Tax History
| Year | Tax Paid | Tax Assessment Tax Assessment Total Assessment is a certain percentage of the fair market value that is determined by local assessors to be the total taxable value of land and additions on the property. | Land | Improvement |
|---|---|---|---|---|
| 2025 | $8,388 | $378 | $151 | $227 |
| 2024 | $3,059 | $395 | $158 | $237 |
| 2023 | $7,255 | $395 | $158 | $237 |
| 2022 | $7,255 | $395 | $158 | $237 |
| 2021 | $6,852 | $393 | $157 | $236 |
| 2020 | $6,995 | $385 | $124 | $261 |
| 2019 | $4,596 | $413 | $125 | $288 |
| 2018 | $4,819 | $440 | $0 | $0 |
| 2017 | $3,908 | $468 | $113 | $355 |
| 2016 | $6,122 | $495 | $367 | $128 |
| 2015 | $2,340 | $552 | $318 | $234 |
| 2014 | $2,340 | $552 | $318 | $234 |
| 2013 | $2,270 | $590 | $379 | $211 |
Source: Public Records
Map
Nearby Homes