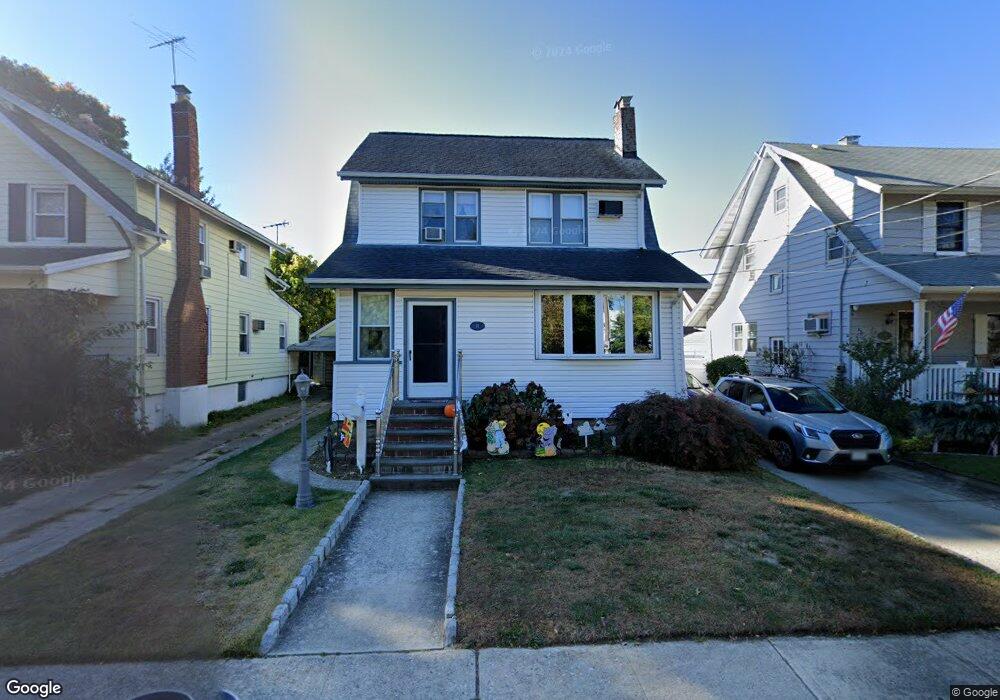
71 Langdon Place Lynbrook, NY 11563
Estimated Value: $603,330 - $686,000
--
Bed
1
Bath
1,318
Sq Ft
$489/Sq Ft
Est. Value
About This Home
This home is located at 71 Langdon Place, Lynbrook, NY 11563 and is currently estimated at $644,665, approximately $489 per square foot. 71 Langdon Place is a home located in Nassau County with nearby schools including Lynbrook Senior High School and Our Lady Of Peace School.
Ownership History
Date
Name
Owned For
Owner Type
Purchase Details
Closed on
Nov 29, 2000
Sold by
Widrow Sylvia
Bought by
Benevent Richard and Benevent Diane
Current Estimated Value
Create a Home Valuation Report for This Property
The Home Valuation Report is an in-depth analysis detailing your home's value as well as a comparison with similar homes in the area
Home Values in the Area
Average Home Value in this Area
Purchase History
| Date | Buyer | Sale Price | Title Company |
|---|---|---|---|
| Benevent Richard | $195,000 | Patrick Di Luccio |
Source: Public Records
Tax History Compared to Growth
Tax History
| Year | Tax Paid | Tax Assessment Tax Assessment Total Assessment is a certain percentage of the fair market value that is determined by local assessors to be the total taxable value of land and additions on the property. | Land | Improvement |
|---|---|---|---|---|
| 2025 | $8,435 | $411 | $163 | $248 |
| 2024 | $868 | $414 | $164 | $250 |
| 2023 | $7,218 | $432 | $171 | $261 |
| 2022 | $7,218 | $432 | $171 | $261 |
| 2021 | $6,725 | $466 | $184 | $282 |
| 2020 | $3,790 | $543 | $370 | $173 |
| 2019 | $6,889 | $582 | $396 | $186 |
| 2018 | $6,822 | $592 | $0 | $0 |
| 2017 | $5,188 | $592 | $403 | $189 |
| 2016 | $6,044 | $592 | $365 | $227 |
| 2015 | $879 | $592 | $365 | $227 |
| 2014 | $879 | $592 | $365 | $227 |
| 2013 | $890 | $653 | $403 | $250 |
Source: Public Records
Map
Nearby Homes
- 2 Fowler Ave Unit 206
- 2 Fowler Ave Unit 228
- 20 Daley Place Unit 128
- 30 Daley Place Unit 247
- 20 Daley Place Unit 104
- 20 Daley Place Unit 225
- 20 Daley Place Unit 127
- 40 Daley Place Unit 124
- 57 Nieman Ave
- 504 Merrick Rd Unit 4J
- 504 Merrick Rd Unit 4E
- 504 Merrick Rd Unit 2k
- 230 Broadway
- 75 Noble St Unit 219
- 75 Noble St Unit 126
- 60 Hempstead Ave Unit 1K
- 60 Hempstead Ave Unit 1H
- 60 Hempstead Ave Unit 1O
- 60 Hempstead Ave Unit 1J
- 181 Walnut St
- 73 Langdon Place
- 75 Langdon Place
- 67 Langdon Place
- 79 Lyon Place
- 75 Lyon Place
- 83 Lyon Place
- 83 Lyon Place Unit 1
- 29 Peninsula Blvd
- 87 Lyon Place
- 26 Langdon Place
- 63 Langdon Place Unit 2
- 63 Langdon Place
- 65 Lyon Place
- 91 Lyon Place
- 61 Lyon Place
- 61 Langdon Place
- 95 Lyon Place
- 57 Lyon Place
- 59 Langdon Place Unit 1
- 59 Langdon Place