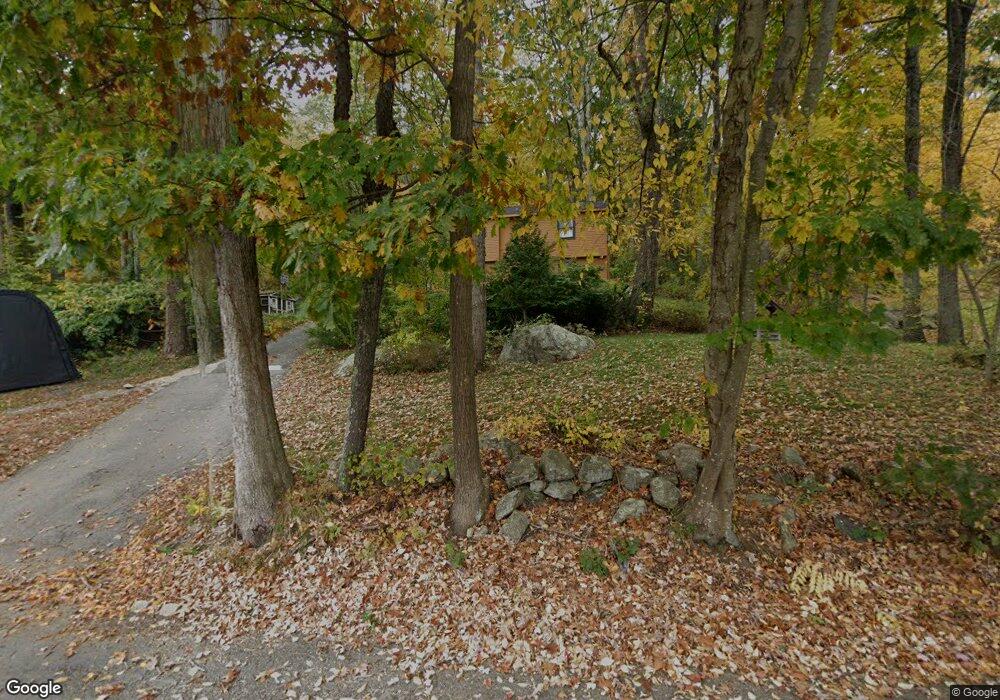
71 Larned Rd Oxford, MA 01540
Estimated Value: $409,000 - $488,000
2
Beds
1
Bath
896
Sq Ft
$500/Sq Ft
Est. Value
About This Home
This home is located at 71 Larned Rd, Oxford, MA 01540 and is currently estimated at $447,950, approximately $499 per square foot. 71 Larned Rd is a home located in Worcester County with nearby schools including Alfred M Chaffee, Oxford High School, and Clara Barton Elementary School.
Ownership History
Date
Name
Owned For
Owner Type
Purchase Details
Closed on
Aug 17, 1999
Sold by
Luchini Christa L
Bought by
Gifford William E and Gifford Lori A
Current Estimated Value
Purchase Details
Closed on
Apr 19, 1991
Sold by
Kozielewicz Henry T
Bought by
Luchini Christa L
Create a Home Valuation Report for This Property
The Home Valuation Report is an in-depth analysis detailing your home's value as well as a comparison with similar homes in the area
Home Values in the Area
Average Home Value in this Area
Purchase History
| Date | Buyer | Sale Price | Title Company |
|---|---|---|---|
| Gifford William E | $124,900 | -- | |
| Luchini Christa L | $111,000 | -- |
Source: Public Records
Mortgage History
| Date | Status | Borrower | Loan Amount |
|---|---|---|---|
| Open | Luchini Christa L | $22,829 | |
| Closed | Luchini Christa L | $10,000 |
Source: Public Records
Tax History
| Year | Tax Paid | Tax Assessment Tax Assessment Total Assessment is a certain percentage of the fair market value that is determined by local assessors to be the total taxable value of land and additions on the property. | Land | Improvement |
|---|---|---|---|---|
| 2025 | $4,590 | $362,300 | $113,900 | $248,400 |
| 2024 | $4,345 | $322,300 | $105,900 | $216,400 |
| 2023 | $4,242 | $311,000 | $94,600 | $216,400 |
| 2022 | $3,765 | $233,000 | $70,500 | $162,500 |
| 2021 | $3,661 | $221,500 | $66,900 | $154,600 |
| 2020 | $3,524 | $211,500 | $66,900 | $144,600 |
| 2019 | $3,127 | $183,600 | $66,600 | $117,000 |
| 2018 | $2,989 | $173,100 | $66,600 | $106,500 |
| 2017 | $2,986 | $177,200 | $66,600 | $110,600 |
| 2016 | $3,000 | $177,200 | $66,600 | $110,600 |
| 2015 | $2,798 | $177,200 | $66,600 | $110,600 |
| 2014 | $2,738 | $182,500 | $66,600 | $115,900 |
Source: Public Records
Map
Nearby Homes
Your Personal Tour Guide
Ask me questions while you tour the home.