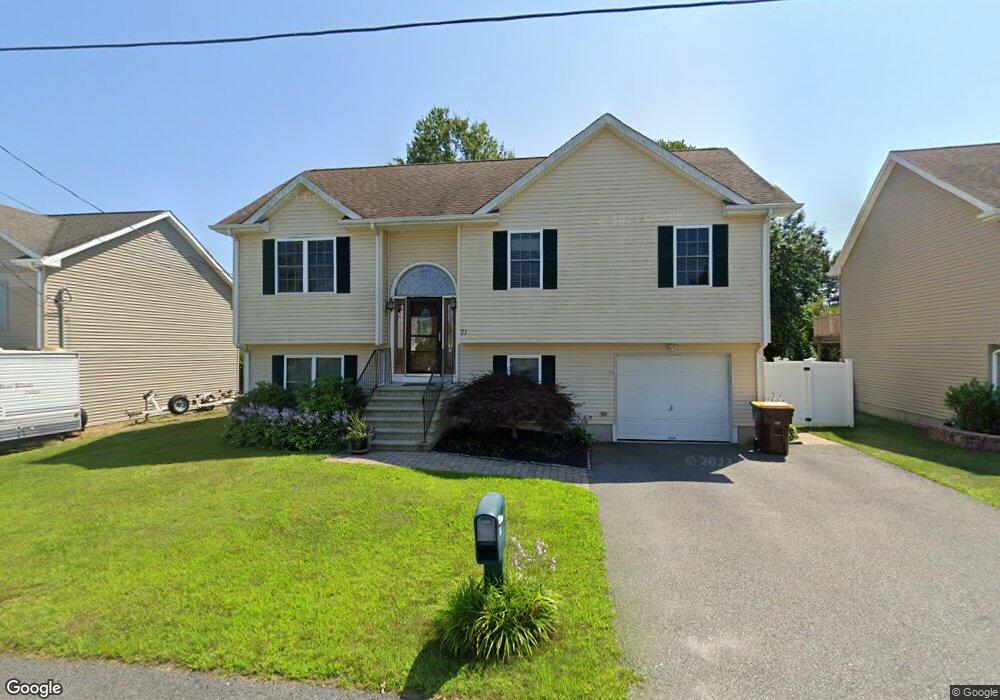
71 Lea Ln Fall River, MA 02721
Maplewood NeighborhoodEstimated Value: $484,626 - $550,000
3
Beds
3
Baths
1,848
Sq Ft
$274/Sq Ft
Est. Value
About This Home
This home is located at 71 Lea Ln, Fall River, MA 02721 and is currently estimated at $506,407, approximately $274 per square foot. 71 Lea Ln is a home located in Bristol County with nearby schools including Henry Lord Community School, B M C Durfee High School, and Argosy Collegiate Charter School.
Ownership History
Date
Name
Owned For
Owner Type
Purchase Details
Closed on
Jun 23, 2010
Sold by
Viveiros Philip
Bought by
Viveiros Philip and Viveiros Jennifer D
Current Estimated Value
Purchase Details
Closed on
Oct 31, 2005
Sold by
Tilt A Whirl Rt
Bought by
Viveiros Philip
Home Financials for this Owner
Home Financials are based on the most recent Mortgage that was taken out on this home.
Original Mortgage
$208,000
Interest Rate
5.79%
Mortgage Type
Purchase Money Mortgage
Create a Home Valuation Report for This Property
The Home Valuation Report is an in-depth analysis detailing your home's value as well as a comparison with similar homes in the area
Home Values in the Area
Average Home Value in this Area
Purchase History
| Date | Buyer | Sale Price | Title Company |
|---|---|---|---|
| Viveiros Philip | -- | -- | |
| Viveiros Philip | $260,000 | -- |
Source: Public Records
Mortgage History
| Date | Status | Borrower | Loan Amount |
|---|---|---|---|
| Previous Owner | Viveiros Philip | $208,000 |
Source: Public Records
Tax History
| Year | Tax Paid | Tax Assessment Tax Assessment Total Assessment is a certain percentage of the fair market value that is determined by local assessors to be the total taxable value of land and additions on the property. | Land | Improvement |
|---|---|---|---|---|
| 2025 | $4,992 | $436,000 | $116,300 | $319,700 |
| 2024 | $4,468 | $388,900 | $114,000 | $274,900 |
| 2023 | $4,391 | $357,900 | $102,700 | $255,200 |
| 2022 | $3,849 | $305,000 | $96,900 | $208,100 |
| 2021 | $3,778 | $273,200 | $92,600 | $180,600 |
| 2020 | $3,678 | $254,500 | $88,400 | $166,100 |
| 2019 | $3,760 | $257,900 | $92,300 | $165,600 |
| 2018 | $3,614 | $247,200 | $93,000 | $154,200 |
| 2017 | $3,178 | $227,000 | $93,000 | $134,000 |
| 2016 | $3,049 | $223,700 | $95,900 | $127,800 |
| 2015 | $2,879 | $220,100 | $95,900 | $124,200 |
| 2014 | $2,769 | $220,100 | $95,900 | $124,200 |
Source: Public Records
Map
Nearby Homes
Your Personal Tour Guide
Ask me questions while you tour the home.